Concordia fast facts
Discover numbers and statistics on our students at Concordia, such as enrolment, class size and graduation.
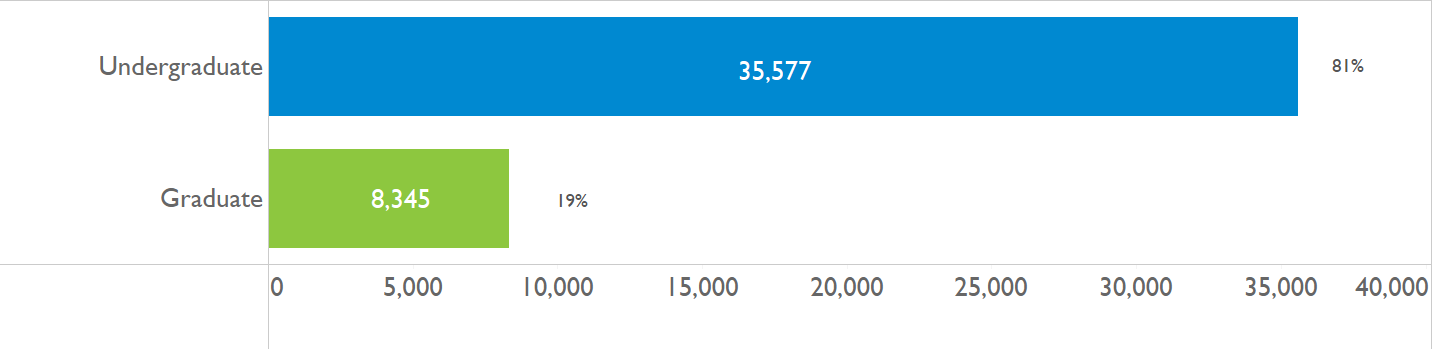
Bar chart comparing Undergraduate and Graduate headcounts. Undergraduate 35,577 (81%). Graduate 8,345 (19%). Total 43,922.
| Student level | Headcount | % credit enrolment |
|---|---|---|
| Undergraduates | 35,577 | 81% |
| Graduates | 8,345 | 19% |
| Total enrolment in courses offered for credit | 43,922 |
| Concordia Continuing Education (CCE) | 4,735 |
|---|
| Grand total | 48,657 |
|---|
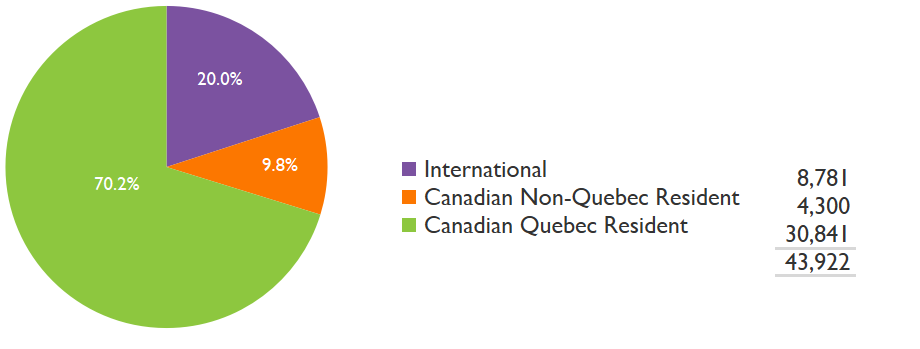
Pie chart showing International 20.0% (8,781), Canadian Non-Quebec Resident 9.8% (4,300), Canadian Quebec Resident 70.2% (30,841). Total 43,922.
- International — 8,781
- Canadian Non-Quebec Resident — 4,300
- Canadian Quebec Resident — 30,841
- Total — 43,922
| Origin | Headcount | % origin |
|---|---|---|
| International | 8,781 | 20.0% |
| Canadian — non-Quebec resident | 4,300 | 9.8% |
| Canadian — Quebec resident | 30,841 | 70.2% |
| Grand total | 43,922 |
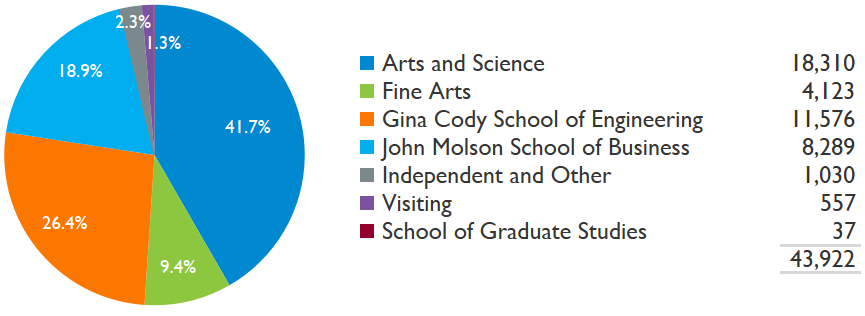
Pie chart of enrolment by faculty: Arts and Science 18,310 (41.7%), Fine Arts 4,123 (9.4%), Gina Cody School of Engineering 11,576 (26.4%), John Molson School of Business 8,289 (18.9%), Independent and Other 1,030 (2.3%), Visiting 557 (1.3%). School of Graduate Studies 37 is in the legend and total but not in the pie. Total 43,922.
- Arts and Science — 18,310
- Fine Arts — 4,123
- Gina Cody School of Engineering — 11,576
- John Molson School of Business — 8,289
- Independent and Other — 1,030
- Visiting — 557
- School of Graduate Studies — 37
- Total — 43,922
| Faculty or enrolment type | Headcount | % of credit enrolment |
|---|---|---|
| Arts and Science | 18,310 | 41.7% |
| Fine Arts | 4,123 | 9.4% |
| Gina Cody School | 11,576 | 26.4% |
| John Molson School of Business | 8,289 | 18.9% |
| Independent and Other | 1,030 | 2.3% |
| Visiting | 557 | 1.3% |
| School of Graduate Studies | 37 | 0.1% |
| Grand total | 43,922 |
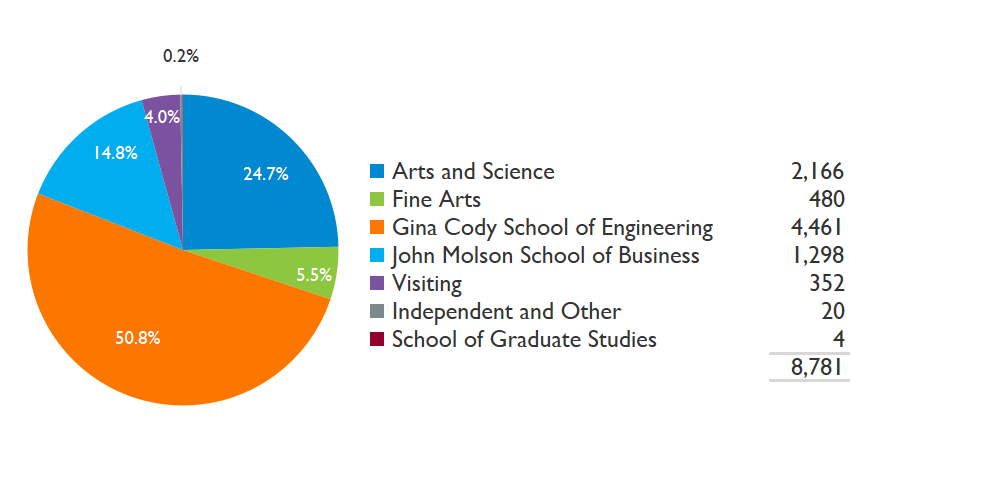
Pie chart showing Arts and Science 24.7% (2,166), Fine Arts 5.5% (480), Gina Cody School of Engineering 50.8% (4,461), John Molson School of Business 14.8% (1,298), Visiting 4.0% (352), Independent and Other 0.2% (20), School of Graduate Studies 0.0% (4). Total 8,781.
- Arts and Science — 2,166
- Fine Arts — 480
- Gina Cody School of Engineering — 4,461
- John Molson School of Business — 1,298
- Visiting — 352
- Independent and Other — 20
- School of Graduate Studies — 4
- Total — 8,781
| Faculty or enrolment type | Headcount | % international enrolment |
|---|---|---|
| Arts and Science | 2,166 | 24.7% |
| Fine Arts | 480 | 5.5% |
| Gina Cody School | 4,461 | 50.8% |
| John Molson School of Business | 1,298 | 14.8% |
| Visiting | 352 | 4.0% |
| Independent and Other | 24 | 0.3% |
| Grand total | 8,781 | 100.0% |
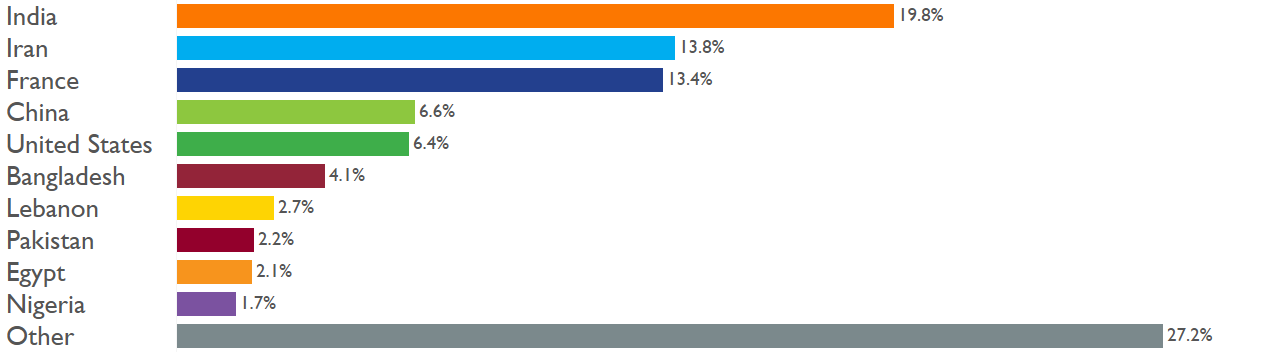
Horizontal bar chart showing: India 19.8%, Iran 13.8%, France 13.4%, China 6.6%, United States 6.4%, Bangladesh 4.1%, Lebanon 2.7%, Pakistan 2.2%, Egypt 2.1%, Nigeria 1.7%, Other 27.2%.
| Country | % visa students |
|---|---|
| India | 19.8% |
| Iran | 13.8% |
| France | 13.4% |
| China | 6.6% |
| United States | 6.4% |
| Bangladesh | 4.1% |
| Lebanon | 2.7% |
| Pakistan | 2.2% |
| Egypt | 2.1% |
| Nigeria | 1.7% |
| Other | 27.2% |
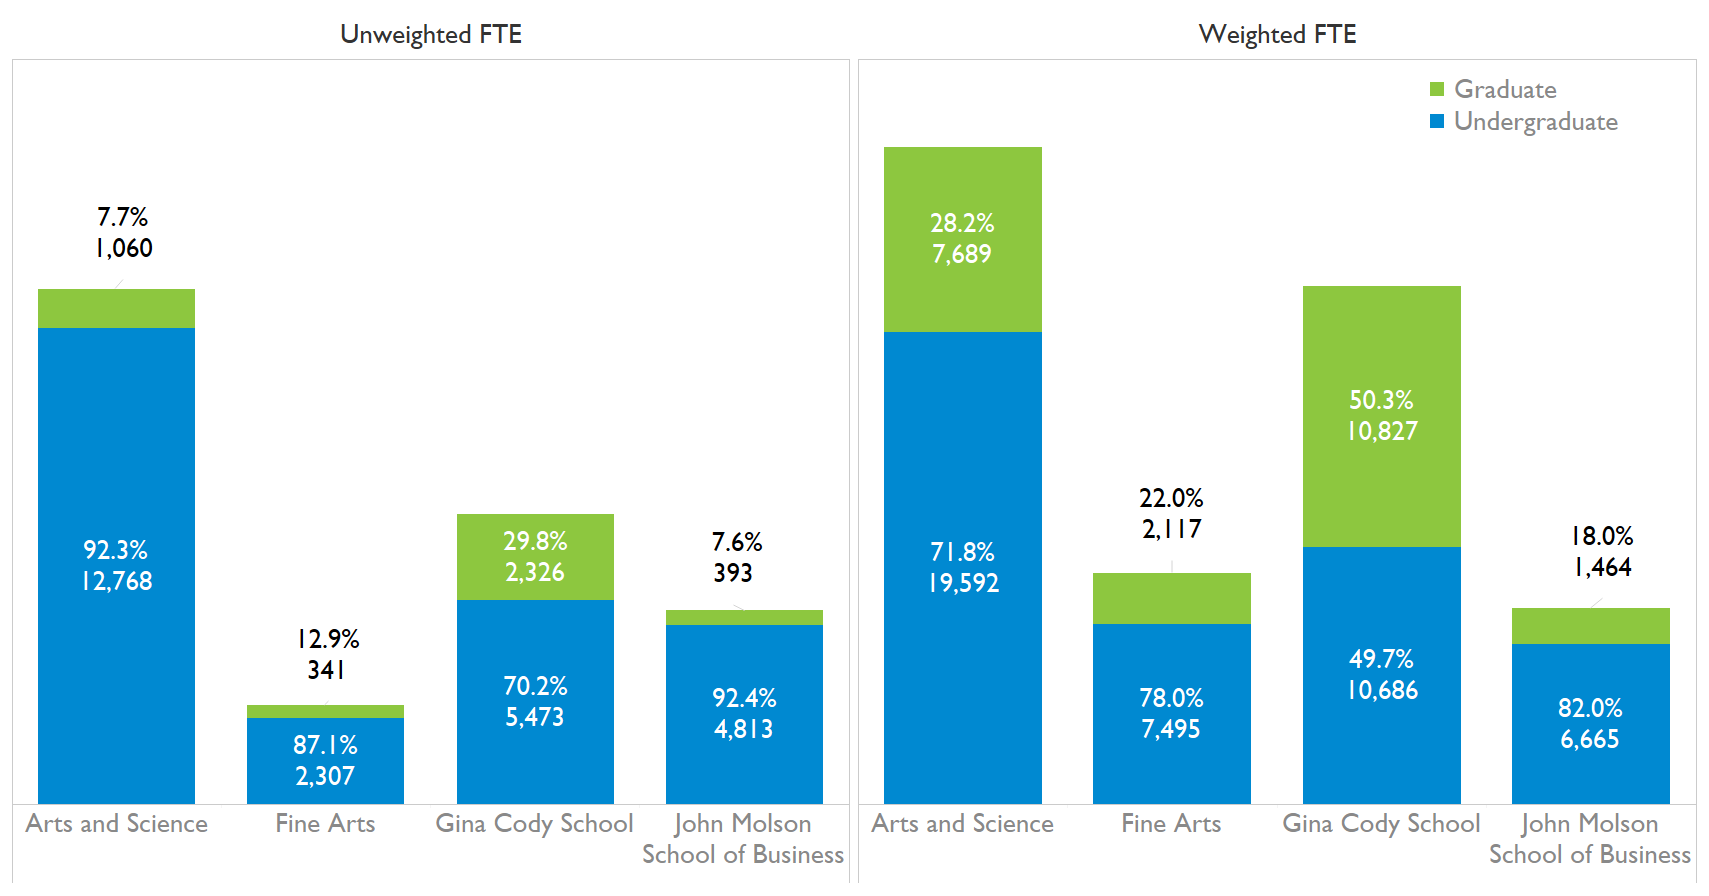
Stacked bars per faculty. Undergraduate and Graduate segments show percent and count. Arts and Science UG 12,768 (92.3%), GR 1,060 (7.7%); Fine Arts UG 2,307 (87.1%), GR 341 (12.9%); Gina Cody UG 5,473 (70.2%), GR 2,326 (29.8%); John Molson UG 4,813 (92.4%), GR 393 (7.6%).
Stacked bars per faculty. Undergraduate and Graduate segments show percent and count. Arts and Science UG 19,592 (71.8%), GR 7,689 (28.2%); Fine Arts UG 7,495 (78.0%), GR 2,117 (22.0%); Gina Cody UG 10,686 (49.7%), GR 10,827 (50.3%); John Molson UG 6,665 (82.0%), GR 1,464 (18.0%).
| Faculty | Undergraduate | Graduate | Total |
|---|---|---|---|
| Arts and Science | 12,768 | 1,060 | 13,828 |
| Fine Arts | 2,307 | 341 | 2,648 |
| Gina Cody School | 5,473 | 2,326 | 7,799 |
| John Molson School of Business | 4,813 | 393 | 5,206 |
| Concordia University FTE | 25,361 | 4,120 | 29,481 |
| Faculty | Undergraduate | Graduate | Total |
|---|---|---|---|
| Arts and Science | 19,592 | 7,689 | 27,281 |
| Fine Arts | 7,495 | 2,117 | 9,612 |
| Gina Cody School | 10,686 | 10,827 | 21,513 |
| John Molson School of Business | 6,665 | 1,464 | 8,129 |
| Concordia University WFTE | 44,438 | 22,097 | 66,535 |
Date: 22-May-25
Includes: Traditionally funded, deregulated
Excludes: Exchange (since non-funded), privatized
Source: Concordia Data Warehouse
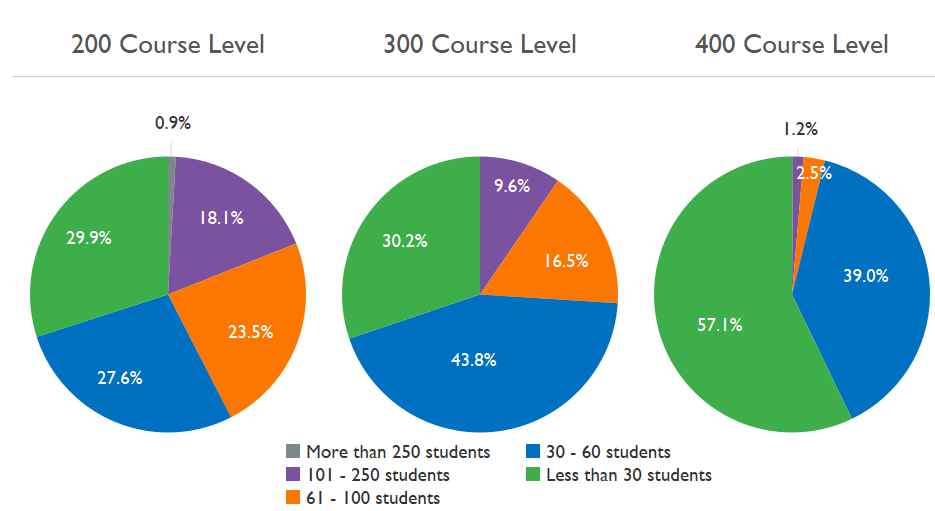
Pie chart showing class size distribution: More than 250 students 0.9%, 101–250 students 18.1%, 61–100 students 23.5%, 30–60 students 27.6%, Less than 30 students 29.9%.
Pie chart showing class size distribution: 101–250 students 9.6%, 61–100 students 16.5%, 30–60 students 43.8%, Less than 30 students 30.2%.
Pie chart showing class size distribution: More than 250 students 1.2%, 101–250 students 2.5%, 61–100 students 2.5%, 30–60 students 39.0%, Less than 30 students 57.1%.
- More than 250 students
- 101–250 students
- 61–100 students
- 30–60 students
- Less than 30 students
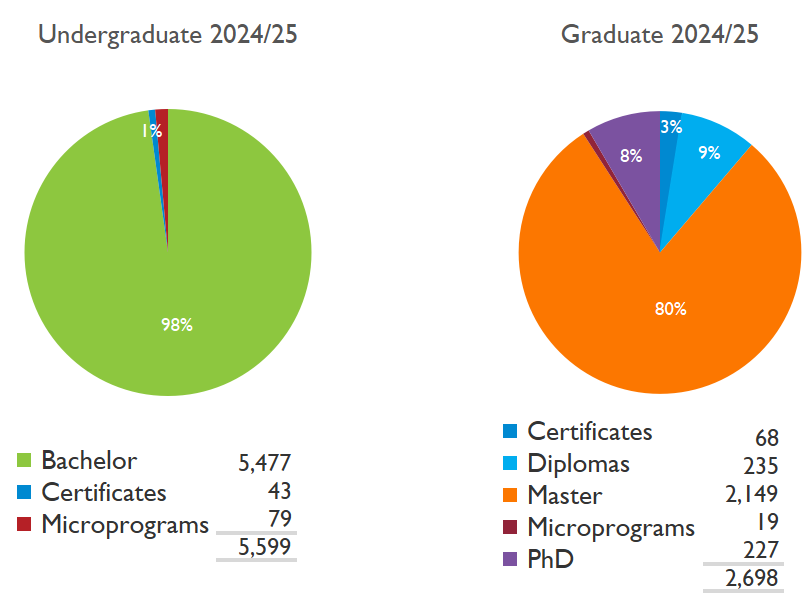
| Degree group | Degrees granted | % degree group |
|---|---|---|
| Certificates | 43 | 0.8% |
| Bachelor's | 5,477 | 97.8% |
| Microprograms | 79 | 1.4% |
| Total undergraduate degrees granted | 5,599 | 100.0% |
| Degree group | Degrees granted | % degree group |
|---|---|---|
| Certificates | 68 | 2.5% |
| Diplomas | 235 | 8.7% |
| Master's | 2,149 | 79.7% |
| Microprograms | 19 | 0.7% |
| PhD | 227 | 8.4% |
| Total graduate degrees granted | 2,698 | 100.0% |
| Grand total | 8,297 |
|---|
Pie chart showing class size distribution: More than 250 students 0.9%, 101–250 students 18.1%, 61–100 students 23.5%, 30–60 students 27.6%, Less than 30 students 29.9%.
Pie chart showing class size distribution: 101–250 students 9.6%, 61–100 students 16.5%, 30–60 students 43.8%, Less than 30 students 30.2%.
Pie chart showing class size distribution: More than 250 students 1.2%, 101–250 students 2.5%, 61–100 students 2.5%, 30–60 students 39.0%, Less than 30 students 57.1%.
- More than 250 students
- 101–250 students
- 61–100 students
- 30–60 students
- Less than 30 students
| Enrolment groups | 200 Course level | 300 Course level | 400 Course level |
|---|---|---|---|
| Fewer than 30 students | 29.9% | 30.2% | 57.1% |
| 30 – 60 students | 27.6% | 43.8% | 39.0% |
| 61 – 100 students | 23.5% | 16.5% | 2.5% |
| 101 – 250 students | 18.1% | 9.6% | 1.2% |
| More than 250 students | 0.9% | 0.0% | 0.1% |