PhD Career Outcomes Report 2025
Tracking the careers of our doctoral graduates
The School of Graduate Studies at Concordia presents: PhD Career Outcomes Report 2025. This report shares the latest look at employment outcomes for Concordia PhD graduates from the graduating years 2014 to 2024. We tracked the career paths of 91% of PhD alumni from this period and recorded over 4300 jobs from public sources (e.g., LinkedIn, company websites). One finding is clear:
Concordia PhD alumni are leaders, making an impact far beyond the walls of the university. Working in 60 countries and across every sector of society, they demonstrate the versatility and value of a Concordia PhD.
Key findings
- We obtained career data for 1601 graduates who graduated between 2014 and 2024 (91% of the total pool of 1902 PhD graduates in this range).
- From this group, we recorded a total of 4372 employment datapoints.
- We found an employment rate of 87% among graduates.
- 43% of our graduates presently work in academia, and 37% work in for-profit/industry. The remaining graduates work in non-profit, self-employed or in public sector roles.
- Approximately 50% of graduates began their careers in academia and about 30% in for-profit/industry.
- Discipline strongly shapes outcomes. The likelihood of going into academia increases by 1.8x for business graduates and 1.5x for those who graduate from fine arts.
- In contrast, the likelihood going into for-profit/industry is 2.2x more for those graduating from engineering and computer sciences.
- Most PhD graduates were able to secure stable employment within the first 20 to 36 months post-graduation. Business and humanities graduates reached stability slightly faster than their STEM peers, reflecting the distinct pathways and timing of different labour markets.
- The most prevalent non-academic job titles are psychologist and data scientist. The top employers include Concordia University, McGill University and the National Research Council.
- Of the graduates who began their careers in Quebec, 58% were still in the province two years after graduation, while 37% remained after three years.
- Our graduates are currently employed in 60 different countries.
Purpose
Earning a PhD marks the beginning of a new chapter, opening doors to many career possibilities. Through this report, we aimed to answer a central question: where do our PhD graduates go, and what impact do they make? By building on our previous 2020 study, we’re able to see how our graduates continue to contribute to society through their career trajectories with global market shifts to better understand the distinct value a Concordia PhD provides, both to our graduates themselves and to the communities they serve.
How it was completed
A team of researchers and staff from the School of Graduate Studies carried out this study. To map the career paths of PhD graduates, we scraped public information from sources such as university and workplace websites, LinkedIn profiles and academic publication portals. After recording all employment data, we then narrowed it to jobs obtained after graduation to focus on post-PhD outcomes. Using a structured classification taxonomy, we categorized employment using four independent dimensions: Sector, Field & Sub-field, Functional Role and Seniority/Rank.
Introduction
Over the past few decades, the career paths of PhD graduates have shifted dramatically. While academic careers were once the default expectation, today graduates are finding opportunities across other sectors. Several factors have driven this shift: the growing number of doctoral graduates, the decline in tenure-track positions and rising expectations for advanced qualifications outside of academia.[1],[2]
The immediate employment shocks of COVID-19 have passed, but its structural effects remain. Remote and hybrid work, early retirements and sectoral shifts continue to shape the labour market, while the acceleration of digital adoption has fueled the rapid rise of AI and automation. Although no longer the primary source of uncertainty, COVID’s legacy — combined with disruptive technologies — continues to reshape employment in 2025 and influence how graduates plan their futures.[3],[4] For today’s PhD students, this means navigating a rapidly changing world of work where industries are transforming, new opportunities are emerging, and traditional roles are being reshaped.
It's no longer enough to assume that PhD training leads to an academic job, nor that PhD graduates want to pursue one. Industry and other sectors increasingly seek PhDs for their advanced research and problem-solving skills — and PhDs are pursuing these opportunities. Institutions should therefore equip students for diverse careers while maintaining strong research training. This starts with understanding where graduates go, the pathways they follow, their acquired skills and how they contribute to society.[5]
Concordia’s PhD Outcomes Report is part of a broader conversation happening at the provincial (through l’Association des Doyennes et des doyens des Études Supérieures au Québec) – national, and international levels. Previous studies at the University of Toronto, McGill University, University of British Columbia and the University of Alberta have all shown that roughly half of PhD graduates remain in academia, while the rest pursue careers in government, for-profit/industry, non-profits or embark on entrepreneurial ventures.[6],[7],[8],[9] Our findings align with these trends: 43% of tracked Concordia PhD alumni currently work in academia.
At the same time, Concordia graduates are contributing across sectors beyond academia: assuming executive roles, becoming entrepreneurs, leading research teams, founding arts organizations and directing international consulting firms. These varied paths demonstrate the versatility of our graduates and the value of a Concordia PhD to recipients and society.
Methodology
This study was carried out by a team of graduate and undergraduate researchers, as well as staff at the School of Graduate Studies.[10] We obtained our graduates’ employment records through publicly available sources, including university and workplace websites, linkedin profiles and academic publication portals (e.g., ORCID and Google Scholar).
For each graduate, we recorded job titles, employers, and the start and end dates of employment where available. While all employment histories were collected, only positions obtained after graduation were retained for analysis to focus on post-phd outcomes.
Classification
All jobs were coded using a structured multi-dimensional classification taxonomy developed specifically for this project. The taxonomy captures four distinct non-orthogonal dimensions:
- Sector (e.g., academia, post-secondary, public, non-profit, for-profit/industry, self-employed),
- Field & Sub-field (e.g., arts, business, STEM, etc.),
- Functional Role (e.g., research, teaching, consulting).
- Seniority/Rank (e.g., entry-level, specialist, manager, leadership, academic rank).
For the analysis, we distinguished between academic positions (e.g., associate professor, lecturer, associate dean) and non-academic positions within post-secondary institutions (e.g., administrators, career counsellors, professional staff). This separation helps distinguish academic from professional post-secondary roles.[11]
Use of AI in classification
To support consistency across thousands of job records, we used openai’s GPT-3.5 to apply our taxonomy (Sector, Field & Sub-field, Functional Role and Seniority/Rank). The model was trained on a sample of manually coded records, applied across the full dataset and then manually reviewed for accuracy.
Validation & data quality
To test data validity, we reviewed a random sample of 75 graduates across multiple public sources and found only less than 2% could not be validated, indicating strong accuracy.
We also tested for consistency among data collectors by assigning overlapping records to different team members. We found the error rate to be less than 1%, thus no systematic corrections were required. Retired and deceased alumni were excluded from the dataset prior to analysis.
Profile of concordia PhD graduates
1902
Total graduates from
2014-2024
1601
Of graduates found in total
49%
from Engineering & Computer Sciences
40%
International status
Overall profile
Our sample consisted of 1,902 phd graduates from Concordia between 2014 and 2024, of which 91% were successfully traced for a total of 1601 phd graduates in our longitudinal analyses.
The distribution of individuals graduating across years we sampled from was relatively stable, averaging between 150 and 200 graduates each year. The largest graduating cohorts were from 2022 and 2023, while 2024 had a smaller number (reflecting the partial year included in our study).
To describe the composition of our sample, we classified graduates by discipline (Fig. 1). Our sample is strongly represented by engineering and computer science disciplines.[12]
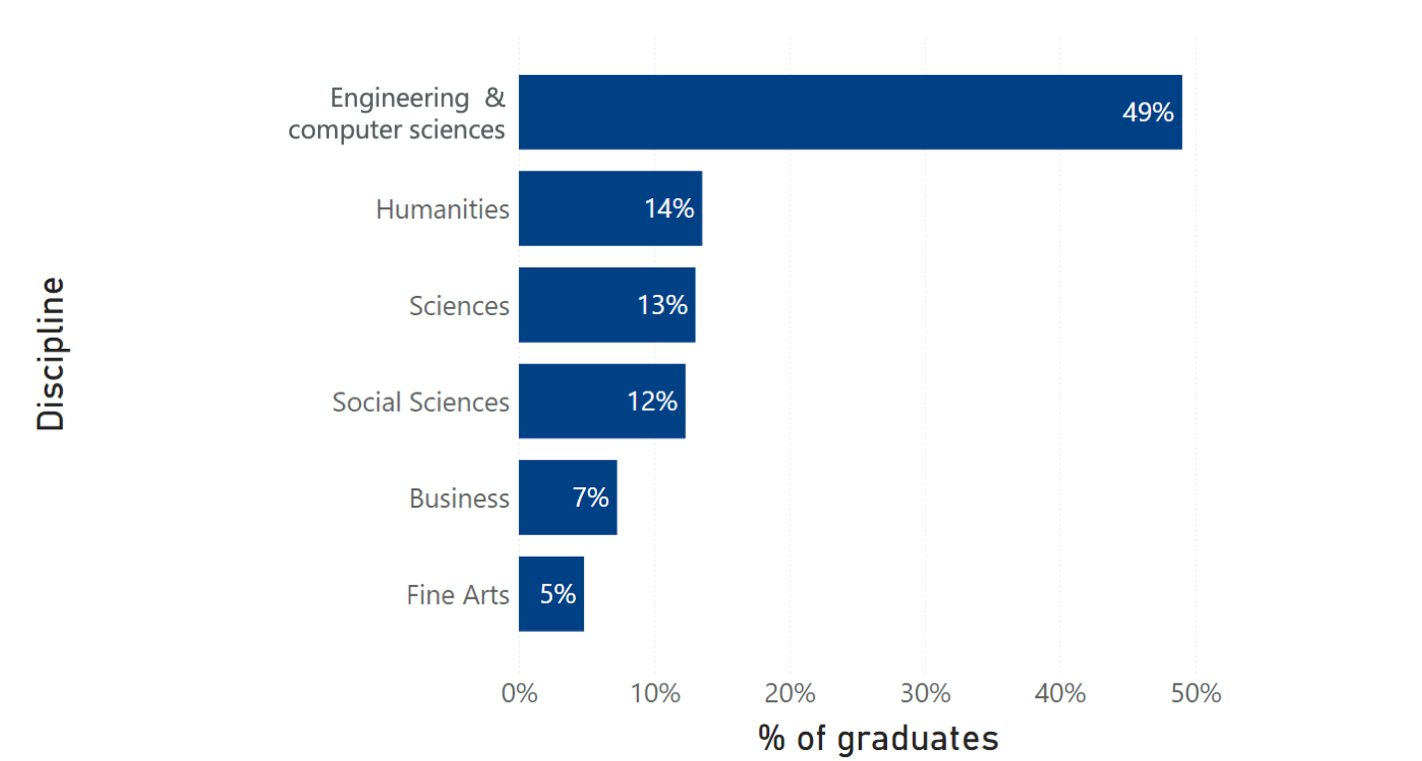 Figure 1. Percent of graduates by discipline.
Department size shapes outcomes, due to larger cohorts contributing more graduates and having a greater influence on the overall totals. To contextualize department-level results, we report the relative size of each phd cohort by department.
From largest to smallest:
- Electrical and Computer Engineering
- Building, Civil and Environmental Engineering
- Mechanical, Industrial and Aerospace Engineering
- Psychology
- Concordia Institute for Information Systems Engineering
Residency status
Concordia’s diverse graduate student population is well-represented in the number of international phds. About 40% of graduates in our sample were international, with the remainder split between Quebec residents (≈33%) and students from elsewhere in Canada (≈27%).[13]
The discipline with the highest number of international students was engineering and computer sciences (67%), followed by sciences (12%), humanities (6%), and business (5%), social sciences (5%), and fine arts (5%).
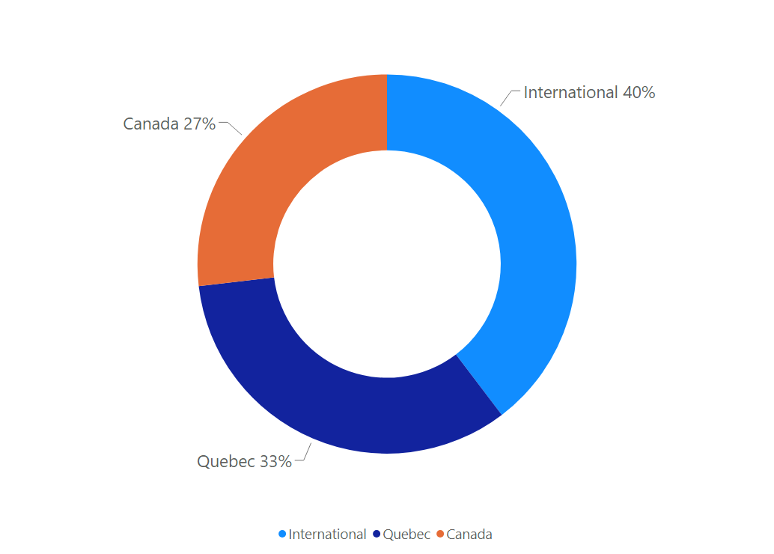 Figure 2. Distribution of graduates by residency status.
Time to degree completion
Time to degree completion varies by discipline. Graduates in sciences and engineering complete fastest, with a median of five years, compared with a median of six years in business and social sciences and about seven years in the humanities and fine arts.
Our study
Overall, this study captures a broad picture of Concordia’s PhD graduates across disciplines, demographics and time. However, it should be noted that our sample is heavily dominated by graduates from the engineering and computer science discipline and those of international status.
Findings - present landscape
Concordia’s PhD graduates are not just leaving with diplomas in hand — they’re stepping into careers that reflect their doctoral training, resiliency and adaptability. The findings from this analysis reveal a story that is both familiar and yet surprising.
Our employment picture is encouraging. Nearly nine out of ten graduates are presently employed, with 19% of our graduates reporting more than one job. At a discipline level, the highest employment percent were those from engineering & computer sciences (90%) followed closely by business (89%).
Employment sector
When we look more closely at where our graduates are currently employed, academia naturally dominates, regardless of years from graduation. Here, we separated traditional industry jobs (e.g., career counsellor, administrators) in post-secondary institutions from jobs that are associated with academia (e.g. Professors, lecturers etc.). About 47% of our phds are in academia, with job titles such as professors, lecturers or postdoctoral fellows.
A significant share of our graduates are employed in sectors outside of academia, which is noteworthy given that phd training is often framed as preparation for academic careers. Among our graduates, we found 39% are employed in the for-profit/industry sector. The remaining non-academic graduates are distributed across government, not-for-profit and self-employed roles.
At a discipline level, business graduates are more than twice as likely to work in academia, while fine arts graduates also show high representation in academic roles. More than 65% of all business graduates are presently in academia. In contrast, engineering and computer sciences graduates are more than twice as likely to go into for-profit/industry roles. Within the social sciences, psychology graduates stand out for their high rates of self-employment in private practice.
 Figure 3. Percent of graduates employed by sector.
Field & sub-field outcomes
Looking at outcomes by field is important because a graduate’s discipline does not always align with the sector or industry in which they eventually work. For example, a phd in psychology may pursue a career in data science at a finance company, or an engineering graduate may work at a pharmaceutical company in the life sciences and health sector. By analyzing employment at the field level, we capture how graduates apply their training in ways that extend beyond their academic discipline.
Because the majority of Concordia phd graduates work in academic settings, education and human services represents the largest field of employment (52%). STEM-related careers account for 25% of graduates, and life sciences and health make up a further 11%. Some fields are highly concentrated by discipline: for example, more than 80% of graduates in engineering and technology roles come from engineering and computer sciences, while 80–90% of those in mental health and clinical practice are social sciences and sciences graduates.
Other fields, such as higher education and government administration, are far more diverse. In higher education, no single discipline dominates, with business (~20%), engineering (~30%), social sciences (~15%), humanities (~15%), sciences (~10%), and fine arts (~5%) all represented. Consulting shows a similarly mixed profile, indicating that some career paths are open across the disciplinary spectrum.
Academic job titles
Of the graduates currently employed in academia, we found the majority to be working as an assistant professor/lecturer (44%), postdoctoral researcher (26%) or associate professor (11%), with the remainder divided among other academic-related titles.
 Figure 4. Fields of PhD graduates by discipline (% of total graduates).
Seniority & entrepreneurs
Our graduates are leaders. We found 17% are currently in a senior or leadership position (e.g., president, executive director). These data also highlight patterns of holding multiple jobs and entrepreneurship. Currently, 19% of graduates hold more than one job, often combining roles such as teaching, research and consulting. 6% are entrepreneurs, launching their own ventures or private practices.
Location
We are proud to report that Concordia PhD graduates represent the university on an international stage, with alumni located in 60 countries. At present, 71% of graduates are based in Canada, including 44% in Quebec and 21% in Ontario.
 Figure 5. Locations of where we traced our PhD alumni.
Overall findings
Our PhD outcomes story is richer when we follow graduates over time. Across all years since graduation, graduates are most often employed in academia, regardless of discipline.
Sectors of employment
Academia remains the single largest employment sector at every timepoint, though its share gradually declines from just under half of graduates at one-year post-graduation to about 40% after five years. Over the same period, the proportion working in the for-profit/industry sector fluctuates slightly but remains at a similar overall level at five years after graduation compared with one year afterwards.
Other sectors, including public, not-for-profit, self-employed and post-secondary education, account for smaller but relatively stable proportions throughout. Note that the proportions in Fig. 6 reflect different groups of graduates at each timepoint, not the same individuals being followed year by year.
 Figure 6. Percentage of graduates per sector by year(s) from graduation.
Time to job stability
Time to job stability is another key part of this story. We define job stability as holding the same job for more than 36 consecutive months. Our data suggest that graduates do not remain in transitional roles for long: about one third are in stable jobs within 12 months of graduation, and nearly half by the two-year mark.
However, differences across disciplines reveal how labour markets shape outcomes.
By 36 months, business phds appear to stabilize fastest, with humanities close behind. In comparison, engineering and computer science phds are slower to stabilize. These differences highlight that the career journey faced by phd graduates is shaped by the structure of each discipline’s job market and the sectors graduates enter.
Field & sub-field outcomes
Discipline describes the training received during a graduate’s studies, while field and sub-field show the work domain where these doctoral skills are applied.
Most of our graduates’ jobs are in fields related to education and human services (52%), followed by STEM (23%). The remainder are in life sciences and health (10%), business and finance (6%), arts, communications and entertainment (5%), and food and agriculture (3%). Outside academia, our graduates are found in roles such as administration, clinical care, consulting, creative production and software development.
Job roles
At one-year post-graduation, nearly 30% of our graduates were in a postdoctoral position. The largest proportion of postdoctoral researchers/fellows at year one came from the sciences (37%), followed closely by engineering and computer sciences (33%). Interestingly, we found the proportion of graduates entering postdoctoral positions one-year post-graduation appears to decline across more recent graduation years. Statistical testing demonstrated a downward trend: for example, ~23% of grads in the early cohorts from our sample took postdoctoral positions, compared with ~9–12% in the most recent cohorts.
 Table 1. Stability of employment across disciplines, measured at one to five years after graduation.
Career pathways
The snapshot by sector in Fig. 6 shows where graduates are at fixed time points after graduation, but it doesn’t show how they get there. To understand movement over time, including who stays in academia, who transitions to industry and when, we analyzed multi-year trajectories and grouped them into career archetypes. This complements the discipline and sector views by revealing typical routes, not just destinations.
From our retention analysis, we found that although academia remains the most stable sector overall, the share of graduates who remain in their initial roles still gradually declines over time. Outside academia, retention is lower, with fewer than half of those who start in public, non-profit or self-employed positions still in the same sector after a decade.
To uncover the underlying pathways, we grouped graduates into five career archetypes based on their employment trajectories:
- Always academic
- Always industry
- Always public service
- Early academic → Industry
- Hybrid portfolio
Here, we found that the “Early academic → industry” archetype is the most common pathway across disciplines. Many graduates begin their careers in academia (47%), but a substantial share (52-60%) later move into longer-term roles in industry or other professional sectors. In other words, academia is often the first stop after graduation, but often not the final destination.
 Figure 7. Five career archetypes based on their employment trajectories.
At the discipline level, graduates from engineering and sciences produce larger shares of “Always academic” careers, while business graduates mostly follow “Early academic → industry” pathway (Fig. 8).
Although business graduates often remain in academia (with about two-thirds still in academia five years after graduation), our pathway analysis reveals that these are not always the same individuals over time. For many, academia is an early stage before moving into industry, while others move in and out of academic roles. This turnover explains why business phds looks highly academic in snapshot data (Fig. 8) yet predominantly fit into the “Early academic → industry” archetype when examined long-term.
Social sciences and sciences contribute significantly to the “Always public service” archetype, reflecting roles in government and public institutions. Humanities, fine arts and education show more varied trajectories, with notable representation in the “Hybrid portfolio” and “Always public service” archetypes.
 Figure 8. Percentage of PhD graduates in each archetype by discipline.
Employers
Employers tell their own story about where Concordia PhDs are in demand. The top academic destinations include Concordia itself, as well as McGill University, University of Montreal, University of Quebec and the University of Toronto. This range of institutions highlights the broad academic research network in which our graduates circulate.
Among non-academic employers, organizations such as Ericsson, Huawei and the Canadian Broadcasting Corporation (CBC) stand out as major recruiters of Concordia-trained PhDs.
Location
Many graduates remain in Quebec, strengthening the province’s research and professional communities. Of the graduates who began their careers in Quebec, 58% were still in the province two years after graduation and 37% remained after three years.
Others relocate broadly across Canada and internationally. We found the top five countries of employment were Canada, the United States, China, Saudi Arabia and Egypt. The distribution of graduates is geographically diverse outside of Quebec with no clear patterns emerging.
Moving forward
At this point, we're equipped to take these insights and translate them into data-driven action. We’ll strengthen our professional development services and review curricula to ensure that both current and future PhD students are prepared for their future careers.
Taken together, these findings tell a powerful story. Concordia phd graduates find work quickly, progress into meaningful careers, and contribute across multiple sectors and borders. While they begin in academia, many move into industry, government, non-profits or entrepreneurship. They find job stability quickly, hold leadership positions and expand the reach of their expertise from Quebec to the world. The value of a Concordia phd is not only apparent to the degree holder, but also to the communities and society they reach.
Concordia PhD pathways reveal:
Earning a doctoral degree shapes innovation, leadership and offers lasting impact.
Acknowledgements
This study was conducted under the leadership of Prof. Rachel Berger, former Associate Dean of Academic Programs and Development, and Prof. Geoff Dover, Interim Dean of Graduate Studies, School of Graduate Studies, Concordia University.
The study was completed thanks to:
- Dr. Javier Ibarra-Isassi, co-advisor
- Kristy Clarke, co-advisor
- Virginia Opara, project lead and data analyst
- Eric Le Mesurier, data collector
- Sahar Shabani, data collector
- Haley Prescott, data collector
With special thanks to Donald Lafrance, Dr. Gina Beltrán, Marie-Eve Roy, Erika MacFadden and Chris Maskell for comments and suggestions throughout the study that improved its quality.
To share your feedback and for further information, please contact Javier Ibarra-Isassi.
Footnotes
[1] Statistics Canada. (2022, December). Occupational profile and work tasks of Canadian PhDs. Statistics Canada Catalogue no. 36-28-0001. Retrieved from https://www150.statcan.gc.ca/n1/pub/36-28-0001/2022012/article/00002-eng.htm
[2] Edge, J., & Munro, M. (2015). Inside and Outside the Academy: Valuing and Preparing PhDs for Careers. The Conference Board of Canada.
[3] Council of Canadian Academies (CCA). (2021). Degrees of Success: The Transition of PhD Graduates to the Labour Market. Ottawa: The Expert Panel on the Labour Market Transition of PhD Graduates, Council of Canadian Academies. Retrieved from https://cca-reports.ca/reports/the-labour-market-transition-of-phd-graduates/
[4] Acemoglu, D., & Restrepo, P. (2021). Tasks, Automation, and the Rise in U.S. Wage Inequality (NBER Working Paper No. 28920). Cambridge, MA: National Bureau of Economic Research.
[5] Baker, M., & Vasseur, L. (2021). Broadening the PhD: Graduate Education for a Changing World. Canadian Journal of Higher Education, 51(3), 1–15.
[6] Reithmeier, R., et al. (2019). 10,000 PhDs Project: Career Pathways for PhD Graduates University of Toronto, School of Graduate Studies.
[7] McGill University. (2021). PhD Career Outcomes Report. Graduate and Postdoctoral Studies, McGill University.
[8] Porter, S., Phelps, J., & Tripp, A. (2017). Where Do PhDs Go? The University of British Columbia Graduate & Postdoctoral Studies.
[9]University of Alberta. (2019, June 25). PhD studies pay off for most graduates, new study shows. University of Alberta Folio. Retrieved from https://www.ualberta.ca/en/folio/2019/06/phd-studies-pay-off-for-most-graduates-new-study-shows.html.
[10] Data was obtained from the University’s Student Information System (SIS) by Concordia’s Institutional Planning and Analysis Office.
[11] Disclaimer on Academic Titles. Academic titles (e.g., assistant professor, associate professor, professor, lecturer) are recorded as they appear in publicly available sources such as LinkedIn or institutional websites. We cannot confirm whether these positions are tenure-track, tenured, or term/contract appointments. Distinctions regarding tenure status, permanent vs. temporary contracts, or teaching vs. research emphasis could not usually be made and are therefore not reflected in this dataset. All faculty positions are included based solely on the title provided.
[12] Disciplinary sectors are determined and used institutionally to categorize programs.
[13] Status in Canada was determined at the time of starting their doctoral program.
Interested in downloading the report?
