Canadian Energy End-Use Mapping project
Project overview
The CanmetENERGY-Ottawa, a division of Natural Resources Canada has the mission of leading the development of energy science and technology solutions for the environmental and economic benefit of Canadians. The programs they direct are aimed at a low-carbon future and cover topics such as bioenergy, transportation, built environment, and CO2 capture, utilization, and storage.
CanmetENERGY-Ottawa is undertaking the Canadian Energy End-Use Mapping project, that involves developing an online map containing building energy end-use and efficiency opportunities and associated data. The scope of this also covers developing best practices and standards to accelerate the adoption of deep energy retrofits and the transition to a low carbon economy. In collaboration with the city of Kelowna, BC, this prototype will characterize residential use and efficiency opportunities in the cities’ housing stock.
The information obtained from this project has use cases including:
- Target setting for energy and emissions performance in the building stock in community energy plans
- Housing energy efficiency program development
- Utility conservation and demand management program planning, including the assessment for conservation to support capital cost offsetting in small geographic areas connected to distribution lines
- Conservation potential reviews
Energy mapping is increasingly recommended as a means of developing inventories and identifying actions for energy efficiency and conservation in the buildings. Access to quality data is a central challenge to the development of inventories and models, including those that are building stock focused. Senior levels of government developing comprehensive bottom-up energy inventories and modelling platforms to help municipalities access data and advance policies and programs in a consistent and comparable manner has only be tackled comprehensively by British Columbia through the Community Energy and Emissions Inventory reports.
To support the mapping of building sector energy end-use, it is important to classify buildings according to a typology and a usage. These two classifications together with the building age and potential retrofit information allow to automatically assign building physics attributes and building usage and scheduling information (including occupant-related assumptions) for each building. This is a necessary step for any kind of building simulation, either quasi-stationary (monthly energy balance) or dynamic. Even if no modeling is performed, a building classification is necessary to assign typology and usage-based consumption values to each building.
Another condition for building modeling and advanced visualization is the handling of urban 3D data. With standardization ongoing for the CityGML format, many cities now have 3D data models using CityGML. The quality of the geometry information still strongly varies and only few cities have all the attributes attached that are needed for energy mapping. This research support will contribute to improve the data handling and attribution process required for energy modeling of cities using Kelowna as a case study.
The role of the Canada Excellence Research Chair (CERC)
The objective of this project is to create a basis of knowledge on key topics, characterize data workflows and perform selected data cleaning and integration tasks. The work done by CERC primarily supported the development of the CEE Map prototype for Kelowna BC with findings shared with related initiatives such as the Building Energy Mapping and Analytics Concept Development Study (BEMA-CDS). The group of researchers worked on the development of a generic, systematic workflow to extract useful information from various data sources for building energy modeling requirements and energy retrofit recommendations. The developed workflow has leveraged datasets originated from various sources and scales in multi-operational platforms to analyze and derive the building data for building energy modeling and mapping. Property assessment records were used to discover Kelowna patterns and distribution of dwelling type and vintage. The Kelowna permit dataset provided information on the building and heating permits registered by the municipality.
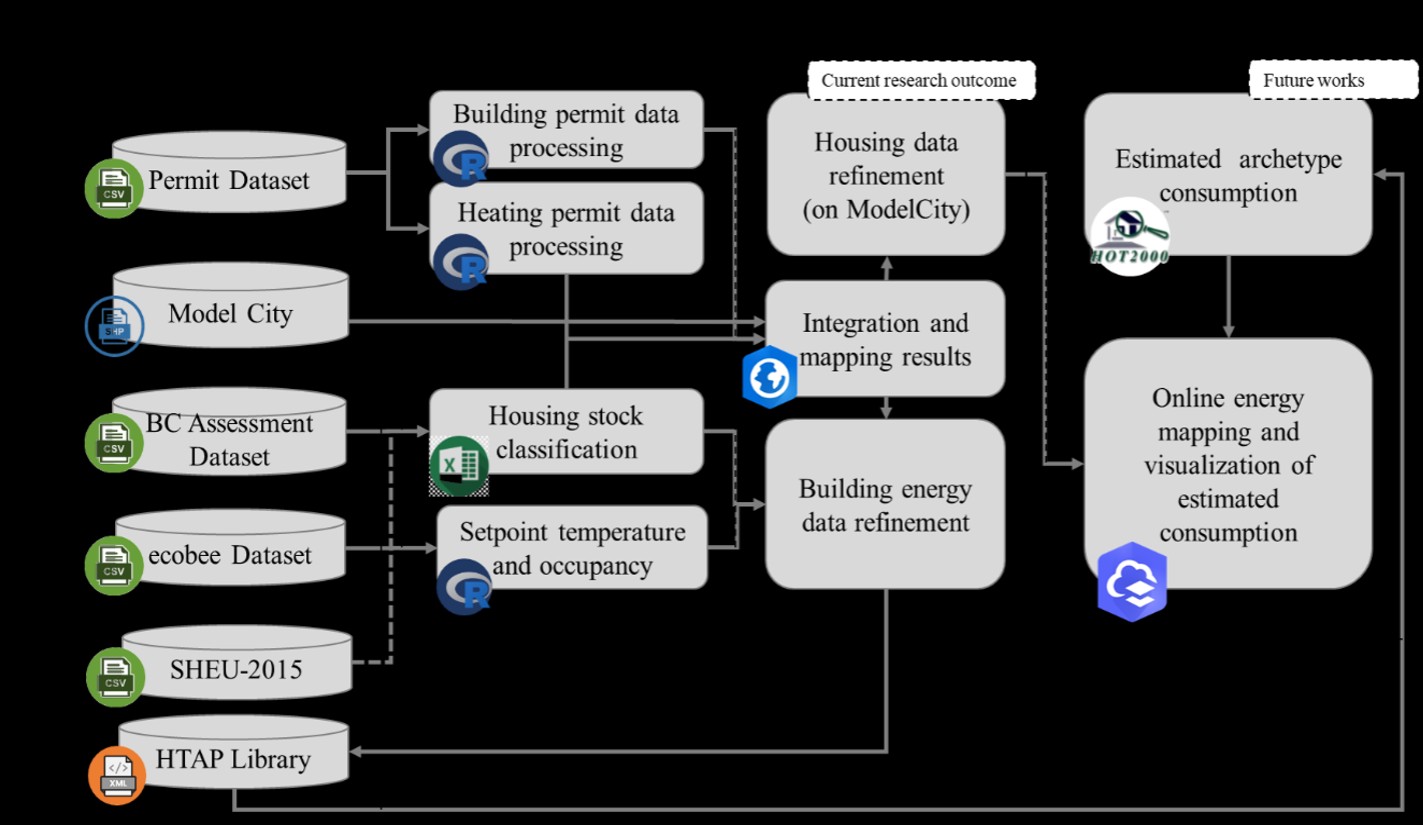
 Figure 1: Workflow explaining the process of building energy mapping from data discovery through results deployment
Title: “Figure 1: Workflow explaining the process of building energy mapping from data discovery through results deployment”
Processes flow from five data sources
- Permit Dataset
- Building permit data processing
- Integration and mapping results + Model City
- Housing data refinement (on ModelCity)
- Online energy mapping and visualization of estimated consumption
- Building energy data refinement
- HTAP Library
- Estimated archetype consumption
- Online energy mapping and visualization of estimated consumption
- Housing data refinement (on ModelCity)
- Integration and mapping results + Model City
- Heating permit data processing
- Housing stock classification
- Building energy data refinement
- HTAP Library
- Estimated archetype consumption
- Online energy mapping and visualization of estimated consumption
- Building energy data refinement
- Integration and mapping results + Model City
- Housing data refinement (on ModelCity)
- Online energy mapping and visualization of estimated consumption
- Building energy data refinement
- HTAP Library
- Estimated archetype consumption
- Online energy mapping and visualization of estimated consumption
- Housing data refinement (on ModelCity)
- Housing stock classification
- Building permit data processing
- BC Assessment Dataset
- Housing stock classification
- Building energy data refinement
- HTAP Library
- Estimated archetype consumption
- Online energy mapping and visualization of estimated consumption
- Building energy data refinement
- Housing stock classification
- ecobee Dataset
- Set point temperature and occupancy
- Building energy data refinement
- HTAP Library
- Estimated archetype consumption
- Online energy mapping and visualization of estimated consumption
- Building energy data refinement
- Set point temperature and occupancy
- SHEU-2015
- Housing stock classification
- Building energy data refinement
- HTAP Library
- Estimated archetype consumption
- Online energy mapping and visualization of estimated consumption
- Building energy data refinement
- Set point temperature and occupancy
- Building energy data refinement
- HTAP Library
- Estimated archetype consumption
- Online energy mapping and visualization of estimated consumption
- Building energy data refinement
- Housing stock classification
- HTAP Library
- Estimated archetype consumption
- online energy mapping and visualization of estimated consumption
- Estimated archetype consumption
Building and heating permit data processing
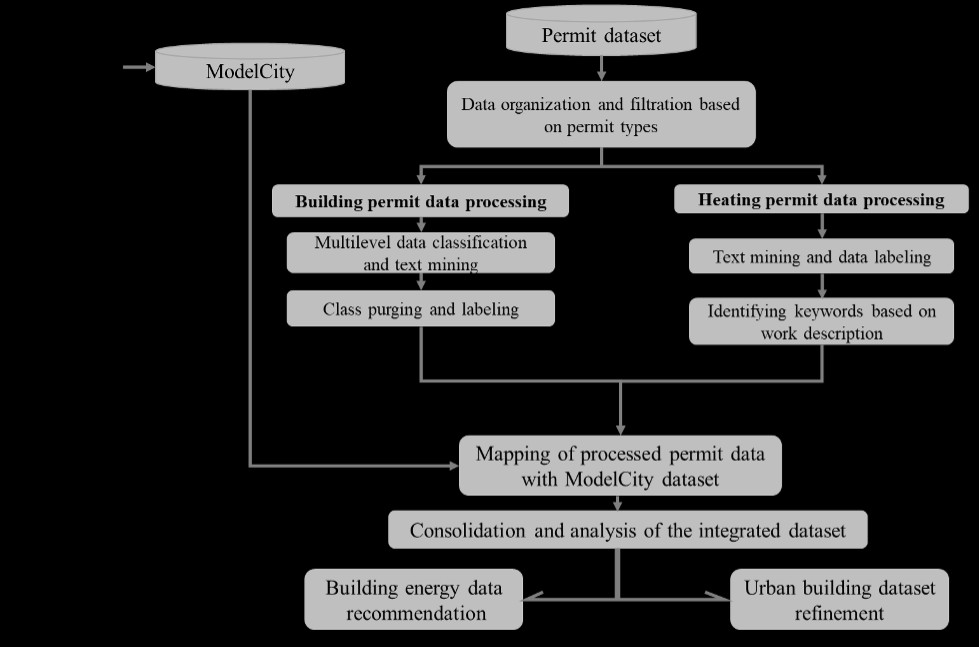
Permit data processing is segmented into four steps, as depicted in Figure 2. The first step is the primary classification of the permit data based on permit status, type, and subtype. This facilitates data organization and management. Exclusion of permits with canceled and not-used statuses enabled filtering of permits already implemented or currently in progress. In the second step, filtered permits were grouped into building and heating for data processing. Each dataset was found to have many missing work descriptions. The exploratory nature of research on permit data processing does not call for filling missing values. The immediate need was to clarify keywords and abbreviations and adjust the dataset with consistent terminology. Various data mining methods were then applied to extract variables affecting building energy performance, such as heating system retrofits or building construction. Characteristics derived from permit processing were conflated with Model City via Kelowna ID (KID), the attribute common to both datasets. Consolidating processed building permit outputs can potentially refine the prototype in two ways: enhance buildings data through refinement of attributes in Model City (e.g., year built, heating system type, and age) or inform housing archetype simulations in Housing Technology Assessment Platform (HTAP).
 Figure 2: Permit data processing workflow
Title: “Figure 2: Permit data processing workflow”
- Permit dataset
- Data organization and filtration based on permit types
- Building permit data processing
- Multilevel data classification and text mining
- Class purging and labeling
- Mapping of processed permit data with ModelCity dataset
- Consolidation and analysis of the integrated dataset
- Building energy data recommendation
- Urban building dataset refinement
- Heating permit data processing
- Text mining and data labeling
- Identifying keywords based on work description
- Mapping of processed permit data with ModelCity dataset
- Consolidation and analysis of the integrated dataset
- Building energy data recommendation
- Urban building dataset refinement
- Building permit data processing
- Data organization and filtration based on permit types
Mapping model city data and heating permit results
Mapping the processed heating permit dataset (containing details about heating permit type and application date corresponding to each KID) and the Model-City dataset (including details on dwelling type and year built) provides valuable insights on heating systems distributed in Kelowna. The integrated dataset provides insight into predominant heating permit types, along with permit application date and spatial distribution in the city. This information allows spatiotemporal classification of buildings based on heating system permit and can be used as a critical indicator for retrofit prioritization.
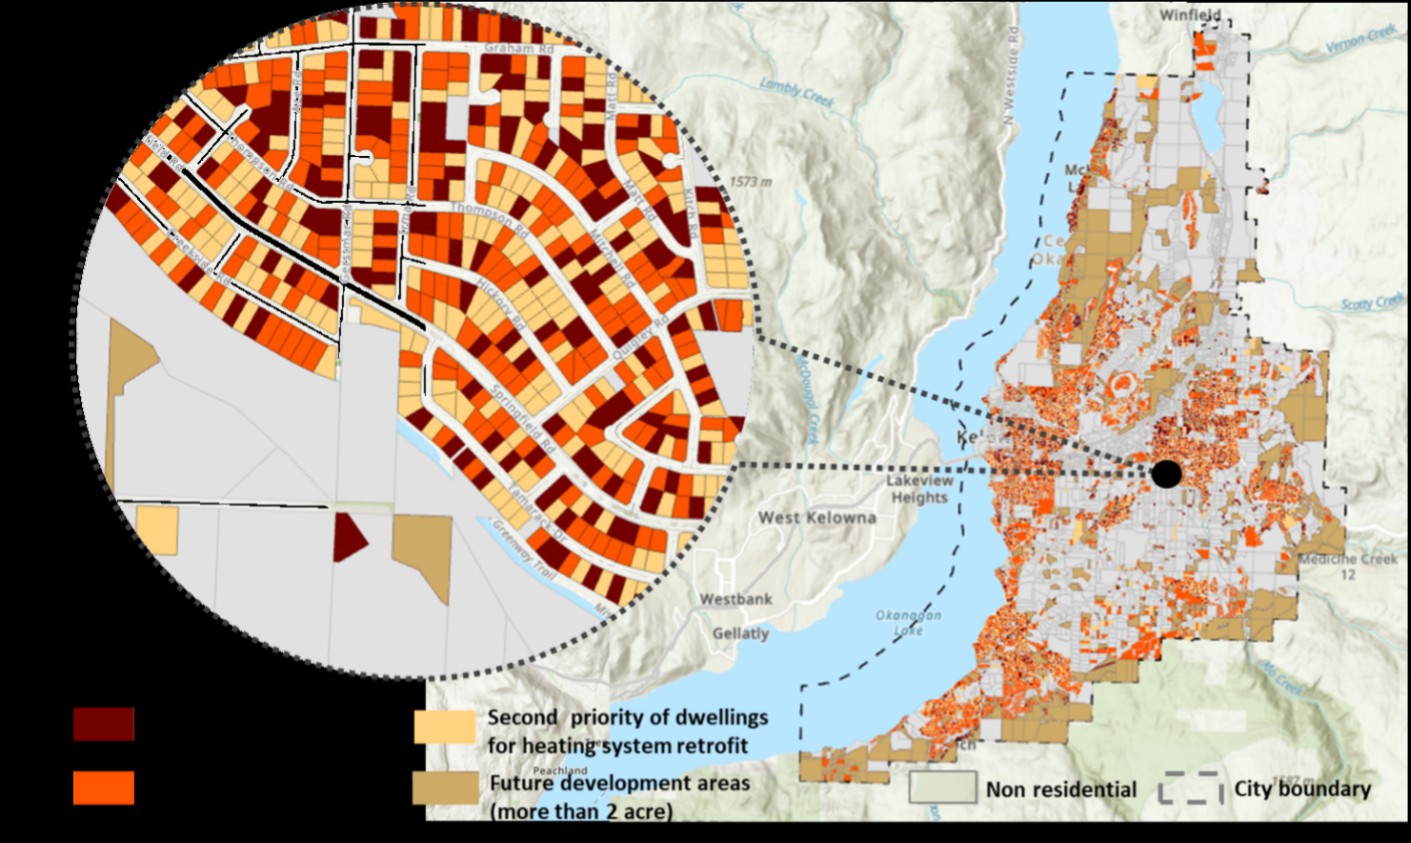
Figure 3 shows a preliminary prioritization of candidate dwellings for heating system retrofit based on heating permit data analysis. On this map, dwellings built prior to 2000 without a permitted heating system replacement are prioritized for a heating system upgrade, this represents 17.5% of Kelowna dwellings. The second priority belongs to buildings constructed before 2000 that have applied for a heating permit. However, the work description of the permit application was missing or was not related to a heating system (e.g., gas-related permits). This group comprises 30% of total dwellings, and more investigation is required to fill in the missing values for better decision-making. The largest group of residential buildings that make 51% of entire dwellings have a post-2000 heating system model with an efficiency greater than 90% Annual Fuel Utilization Efficiency (AFUE). This group is composed of dwellings built after 2000 or the buildings with construction year < 2000 that have applied for a type of heating system permit. The last residential group, making 1.5% of Kelowna configurated parcels, does not include living areas within the lots and are categorized as future development in Figure 3.
 Figure 3: The spatial classification of buildings with the priority of heating system retrofit regarding their heating permit analysis
Recommendations from the study
Based on the analysis conducted in this project, the following recommendations are made to the City of Kelowna municipality on permit data collection strategies, energy system retrofits and modelling assumptions on thermostat setpoint temperature and occupancy:
- Use standard terminology to collect and maintain datasets on buildings and their attributes specific to energy performance. In addition to the EnerGuide Rating System terminology, explore existing data dictionaries such as Building Energy Data Exchange Specification (BEDES) and Building Smart (Building Smart) for this purpose.
- Collect and maintain building attributes in Model City at the building level, enabling aggregation to the parcel level. Currently unique IDs are assigned at the parcel scale (KID). Assess the value and applicability of adopting the unique numeric identifiers assigned to buildings by Statistics Canada in the Open Database of Buildings (ODB), as this would link structures to census geographies. This would provide a unique geo-referenced numeric identifier for buildings, stabilizing building data collection efforts, and assists data processing from local to the national scale.
- Collect and maintain heating and building permit data systematically using digital geo-referenced mobile applications. If work descriptions for all permits were available, analysis would be more accurate and reliable. As mentioned earlier, potential sources of additional attributes may be EnerGuide audits or provincial or utility incentive programs.
- Increase the fidelity of heating permit data collection by defining additional attributes to be collected (for instance, heating system type and efficiency). The resulting data could then be used to make recommendations for effective housing retrofit, energy planning and in future support alterations code compliance.
- Provide real-time integration between the issued permits and the major datasets containing building information, such as Model City.
- Integrate data on furnace and hot water tank replacements from other related sources to fill the missing work descriptions and support improved targeting of candidate dwellings for mechanical system replacements.
- Consider using heating and cooling setpoint profiles obtained from ecobee data analysis in HTAP housing simulations and compare against simulations run using standard EnerGuide Rating system operating conditions.
- Finally, the ecobee data suggests that 87% of the dwellings evaluated are occupied more than 50% of the time. This contrasts with the occupancy assumption in the EnerGuide Rating System and by extension HTAP simulations. Since occupancy input directly affects the appliance load in a building, it is recommended to investigate the effect of change in occupancy in the simulation results.

