2023 Employment Equity Census
2023 Employment Equity Census
In March 2023, Concordia faculty and staff were invited to participate in a university-wide equity census.
Collecting and analysing this sociodemographic information is an essential first step for the university to meaningfully address underrepresentation and examine institutional barriers that prevent employees and students from fully participating in university life.
While employment equity legislation requires that Concordia collect data with respect to designated groups (i.e., women, Indigenous persons, linguistic minorities, racialized persons, and persons with disabilities), Concordia’s census exercise also invited other equity-deserving groups such as members of 2SLGBTQIA+ communities to self-identify.
Data collection
The census was sent to 7333 active faculty and staff.
A total of 2769 respondents completed the census, distributed as follows, which represents a 37.8% response rate:
- Academic staff: 51.8% (1,435)
- Non-academic staff: 48.2% (1,334)
Analysis
The sample size of 2769 respondents yields an estimated margin of error of ±1.5% at a 95% confidence level. While a small portion of the data, approximately 4.9%, may reflect minor irregularities, all survey responses were included in the analysis, as specific cases could not be identified for exclusion.
Results
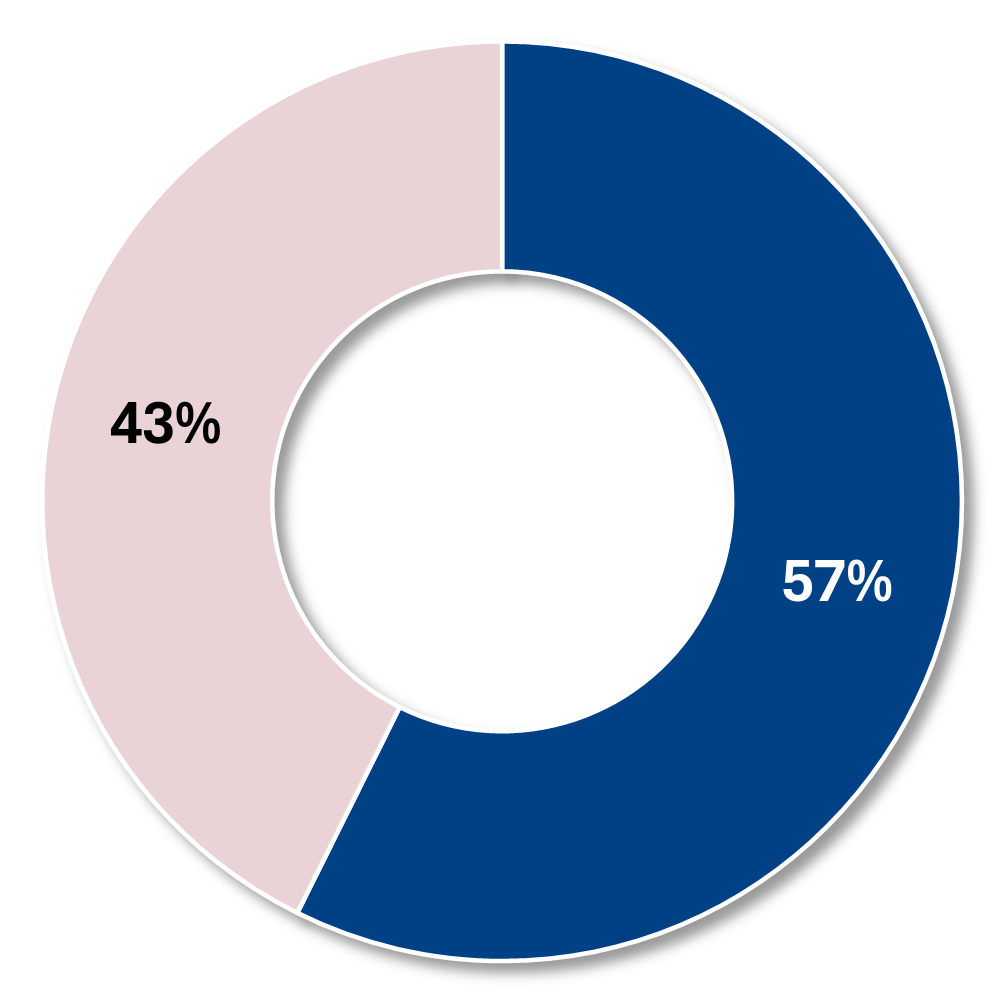
Representation of women
Nearly six out of ten employees at Concordia are women (57.3%), which is higher than the Canadian population (50.6%), in the Canadian workforce (47%), and in the populations of Quebec and Montréal (50%).
| Legend | Group | Number | Percentage |
|---|---|---|---|
| Those who identify as women | 1588 | 57.3% | |
| Those who do not identify as women | 1181 | 42.7% | |
| Total | 2769 | 100.0% |
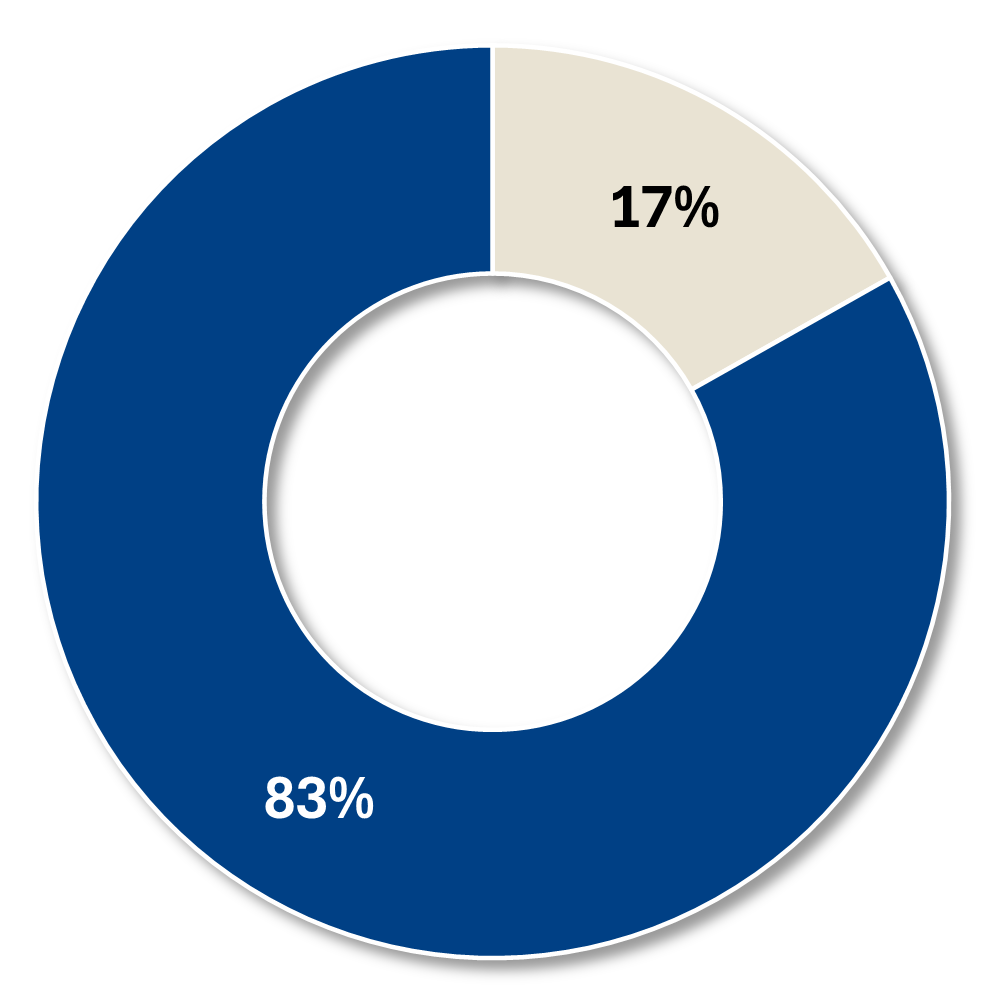
2SLGBTQIA+ representation
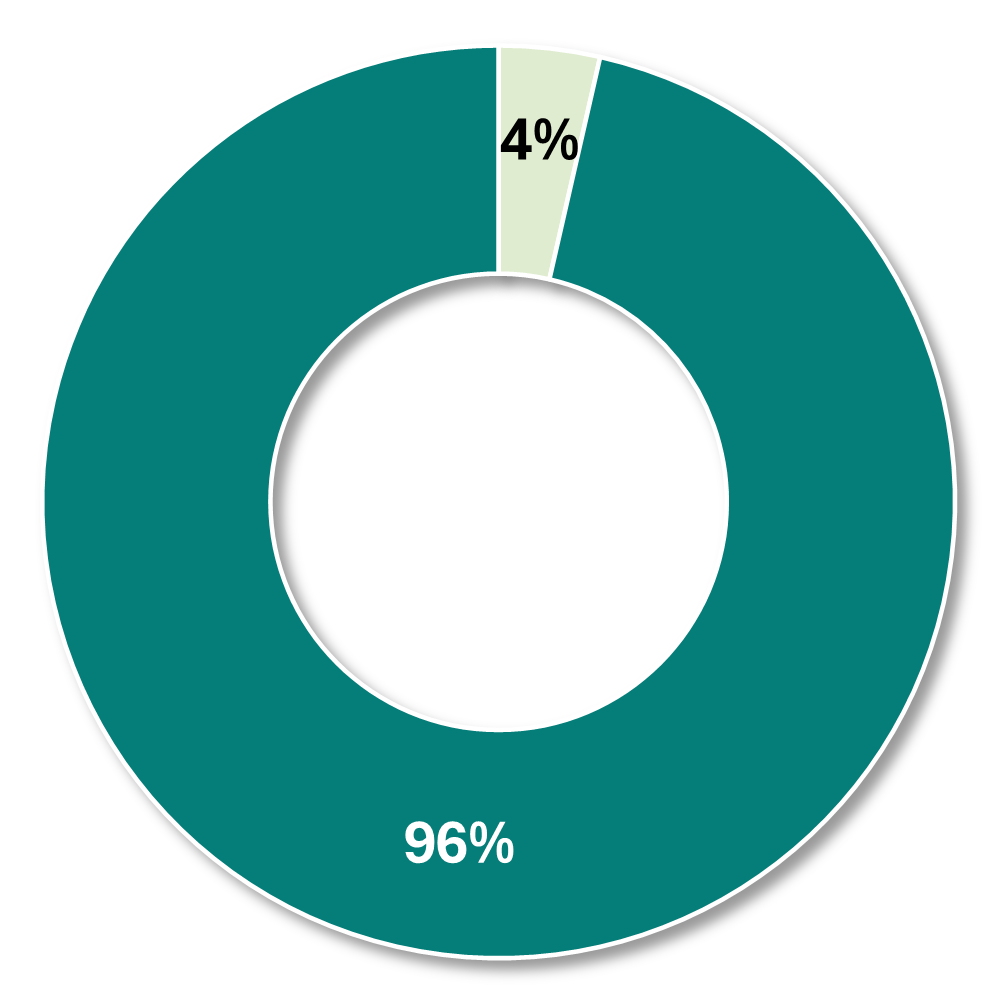
About 16.8% of Concordia employees identify as a member of a 2SLGBTQIA+ community, which is higher than the Canadian population (3.3%). Many respondents who identified as members of a 2SLGBTQIA+ community also responded to questions pertaining to sexual orientation and/or gender identity. Approximately 3.6% of Concordia employees identify as a trans person or as a member of a gender-diverse community, which is higher than the Canadian population (0.33%)
Note: The number of responses to these two questions differs from others in the survey, as respondents had the option to skip them. Specifically, 1,521 individuals answered the question regarding identification with 2SLGBTQIA+ communities, and 1,539 responded to the question about identifying as trans or gender-diverse.
| Legend | Group | Number | Percentage |
|---|---|---|---|
| Those who identify as part of a 2SLGBTQIA+ community | 256 | 16.8% | |
| Those who do not identify as part a 2SLGBTQIA+ community | 1265 | 83.2% | |
| Total | 1521 | 100.0% |
| Legend | Group | Number | Percentage |
|---|---|---|---|
| Those who identify as trans or gender diverse | 55 | 3.6% | |
| Those who do not identify as trans or gender diverse | 1484 | 96.4% | |
| Total | 1539 | 100.0% |
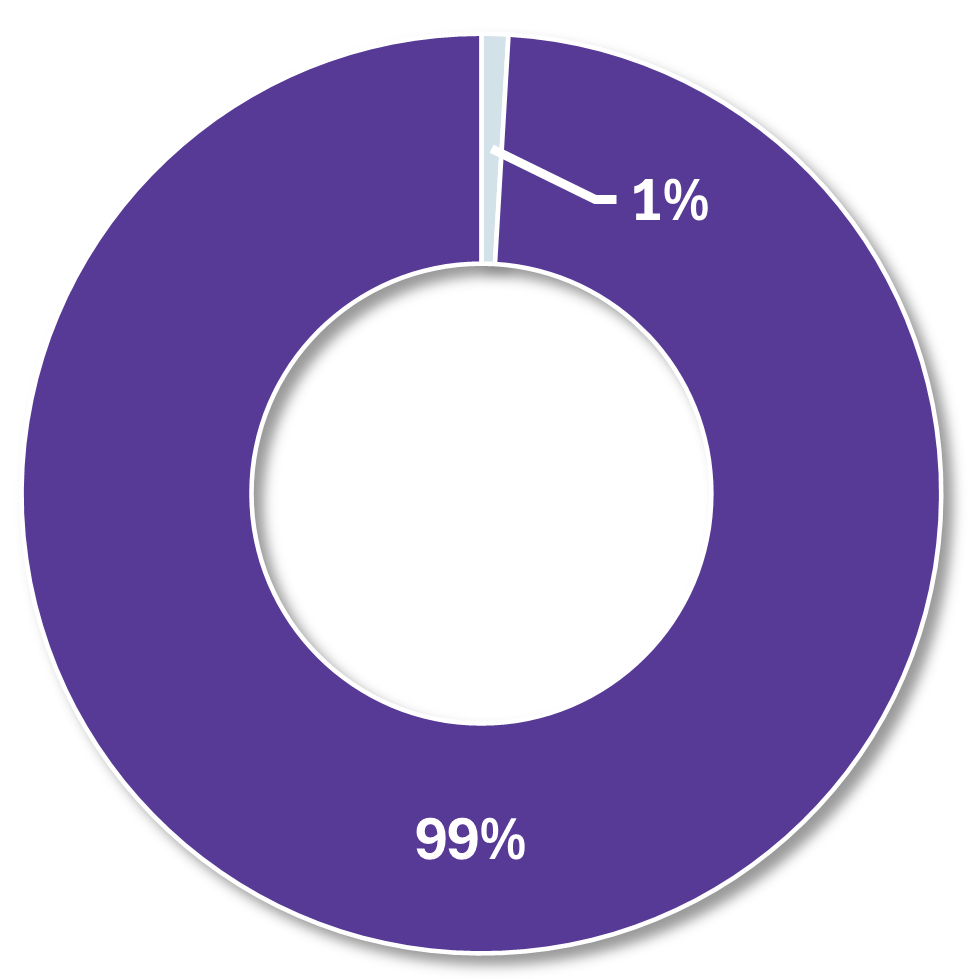
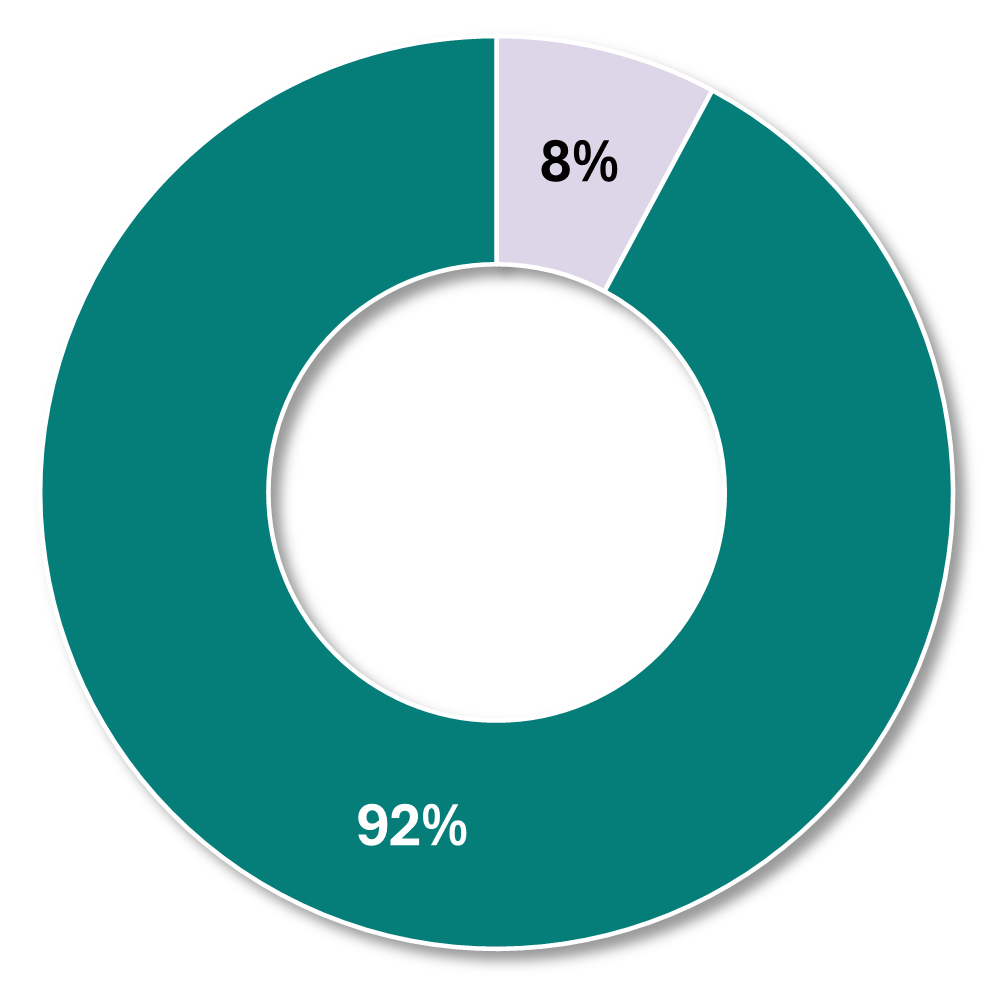
Indigenous peoples
0.9 % of Concordia’s employees identified as Indigenous, similar to the proportion of Indigenous people in Montréal (0.9%). The proportion of Indigenous people among Concordia’s employees is nevertheless lower than proportions amongst Canada’s population (5%) and in the Canadian workforce (3.6%).
| Legend | Group | Number | Percentage |
|---|---|---|---|
|
|
Those who identify as Indigenous | 26 | 0.9% |
|
|
Those who do not identify as Indigenous | 2743 | 99.1% |
| Total | 2769 | 100.0% |
Racialized peoples
25.0% of Concordia employees identified as a racialized person, similar to the findings of the 2021 employment equity census. This is lower than the Montréal population (31%), but similar to the Canadian population (26.5%) and workforce (26.5%), and slightly higher than in Canadian universities (estimated to be 21% based on available census data). The proportion of racialized people among Concordia’s personnel is higher than the proportions in Quebec’s population (16.1%).
| Legend | Group | Number | Percentage |
|---|---|---|---|
|
|
Those who identify as racialized | 692 | 25.0% |
|
|
Those who do not identify as racialized | 2077 | 75.0% |
| Total | 2769 | 100.0% |
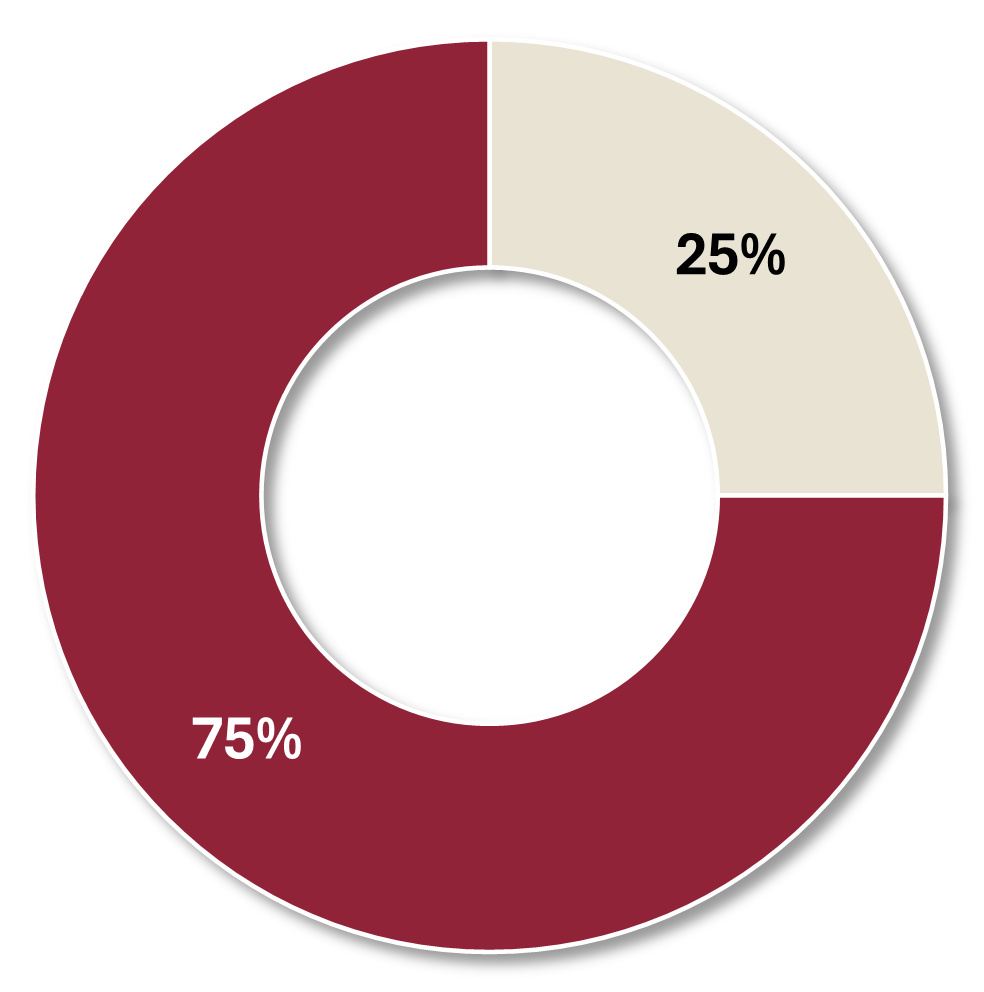
Linguistic minorities
13.9% of Concordia's personnel identify as linguistic minorities. This marks a significant decrease from the previous employment equity census, where 31% of employees identified as a linguistic minority in 2021. Given this decrease, we will be investigating the causes of this shift. The current proportion is lower than the proportion in Canada’s population (23.4%), though similar to Quebec’s population (14.9%).
| Legend | Group | Number | Percentage |
|---|---|---|---|
| Those who identify as a linguistic minority | 384 | 13.9% | |
| Those who do not identify as linguistic minority | 2385 | 86.1% | |
| Total | 2769 | 100.0% |
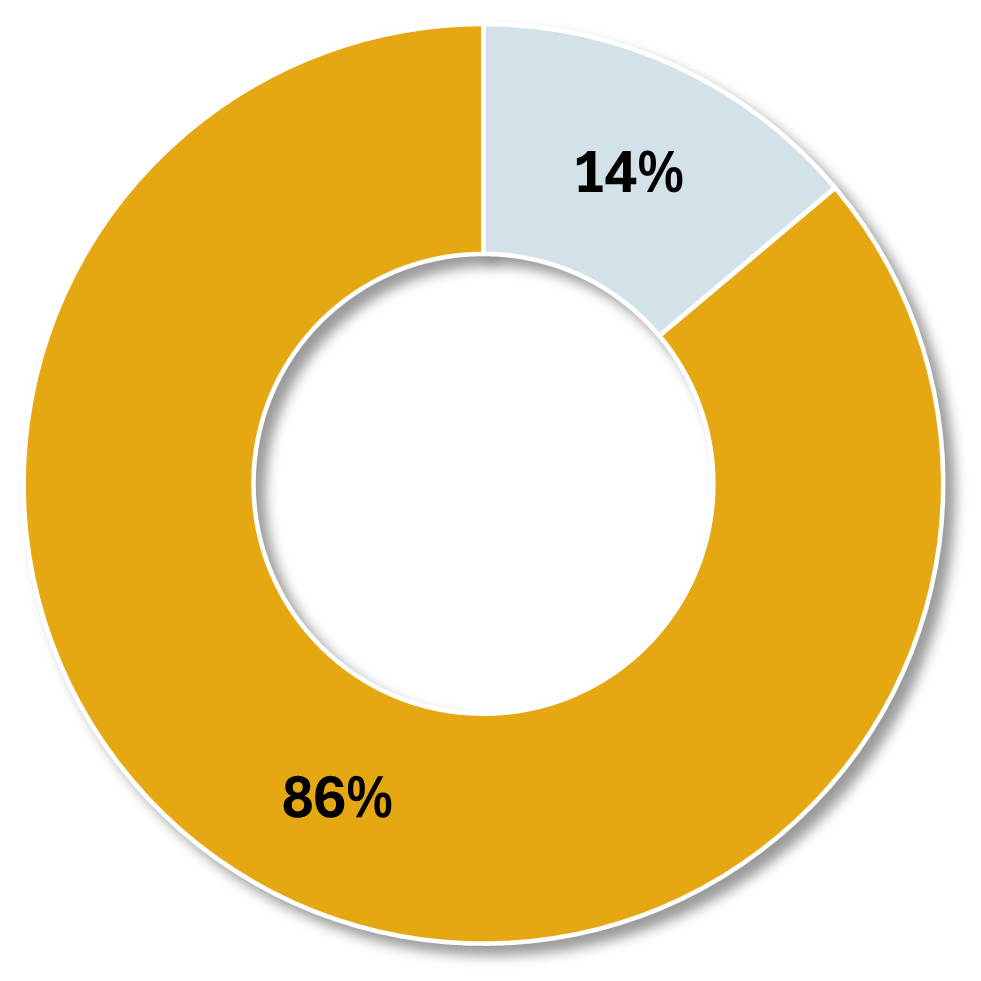
People with disabilities
7.8% of Concordia’s employees reported a disability. This is lower than Montréal and Quebec (21%), the Canadian population, and the national workforce. According to data from Statistics Canada and the 2022 Canada’s Disability Inclusion Action Plan, 27% of Canadians have a disability, and 59% of those individuals are employed, indicating that 16% of the Canadian workforce consists of persons with a disability.
Note: The Statistics Canada definition of disability may include more people, which means the gap observed here may be lower in reality. Further data collection will generate more insight.
| Legend | Group | Number | Percentage |
|---|---|---|---|
|
|
Those who identify as a person with disabilities | 217 | 7.8% |
|
|
Those who do not identify as a person with disabilities | 2552 | 92.2% |
| Total | 2769 | 100.0% |
Context
The results represent a snapshot of Concordia’s employee population in time. Due to small samples sizes in some cases, we were not able to generate detailed data specific to Faculties and sectors. With continued iterations of this exercise, we will be able to conduct more localized analyses as well as monitor enduring trends and new shifts concerning the demographics of our community. This information gathering will better inform the university’s equity goals and strategy.
A note about the data: The census may have attracted more respondents who are members of underrepresented communities in the Quebec and/or Canadian population. As such, the picture presented by the data may be influenced by increased representation of certain subgroups. Results should be interpreted with this in mind; we hope future census exercises will provide more data to analyze with a higher degree of certainty.
The report also indicates the need for a more nuanced understanding around the multiplicity of identities within broad groups (e.g., racialized persons, linguistic minorities, and 2SLGBTQIA+ communities) as well as a better comprehension regarding the representation of these groups in leadership positions and other roles at Concordia.
Data collected within the survey were also compared with information regarding the general Canadian population (for example, the 2021 Canadian census), Canadian workforce, Quebec population, and Montreal population. It is important to note here that for some of the survey topics, data from those populations were unavailable.
We will continue to undertake an iterative approach to our data collection to ensure we have a better understanding of the makeup of our community.
Process and next steps
Concordia will continue to conduct this exercise on a regular basis and share the results with the community so we can collectively track our progress and be data informed in our next steps.
Concordia will consider modifications to the census content at particular intervals so that it continues to reflect the demographics, experiences and aspirations of the university.
Questions? Contact us
Please contact equity@concordia.ca for any questions or concerns regarding the Concordia equity census.