article
The Concordia mobile app: how we measure engagement and performance
Concordia’s mobile app is a key tool for staying connected to campus life, from important updates to everyday student services.
Managed by the UCS web team, the app continues to evolve to better support our community’s needs. In 2024, the app underwent a substantial platform upgrade that made major improvements to its functionality, performance and overall user experience.
If you haven’t explored it yet—or haven’t checked it out in a while—it’s available for download on the App Store and Google Play.
Useful features in the Concordia app
The Concordia app features the following:
- Class schedule and grades
- Important dates
- Student tips
- Admissions information
- University faculty and staff directory
- Alerts and safety information
- University campus maps
- Shuttle bus schedules
- Live shuttle bus tracker
- Athletics and recreation
- Library services
Most viewed pages in 2025
- Class schedule (clicked from landing page) - 2,440,078 views
- Course grades (clicked from landing page) - 1,033,896
- Account balance (clicked from landing page) - 214,336
- My Moodle - 199,468
- Shuttle schedule (clicked from landing page) - 144,094
- Class Schedule (clicked from My account) - 87,148
- Shuttle tracker (clicked from landing page) - 54,458
- Course grades (clicked from My account) - 47,971
- Visit concordia.ca - 44.534
- SGW map (clicked from landing page) - 44,070
Mobile app statistics from 2021 to 2025
Key statistics about how people use the app help us understand how it has evolved over the years.
User engagement and retention
The first metric we look at is user engagement and retention to measure how users interact with the app, including:
- how frequently they use it
- which features are most popular
- how long they spend on the app
We are happy to report that our mobile app usage has been consistently growing over the years. For example, we've measured an increase in time spent using the app and more unique users on the app since 2022.
App performance metrics
Next, we keep an eye on the app's performance data to track issues like crashes, slow loading or errors. By closely monitoring these stats, developers can find areas to enhance to make the app run smoother.
We are pleased to say our mobile app has been consistently stable with no major outages in the past few years.
User traffic statistics over the years
Take a look at how app usage has evolved over the years according to different types of metrics.
Notes:
Each annual sample of statistics is taken from September 1 to December 31.
A major app revamp (new interface and information architecture) was launched on December 10, 2024.
Unique users
The unique users statistic counts individual users to the app over a given period of time. This metric measures the user regardless of their number of visits or whether they were a first-time visitor to the app.
| Year | Number of unique users |
|---|---|
| 2025 | 44,361 |
| 2024 | 44,306 |
| 2023 | 44,251 |
| 2022 | 41,283 |
| 2021 | 36,744 |
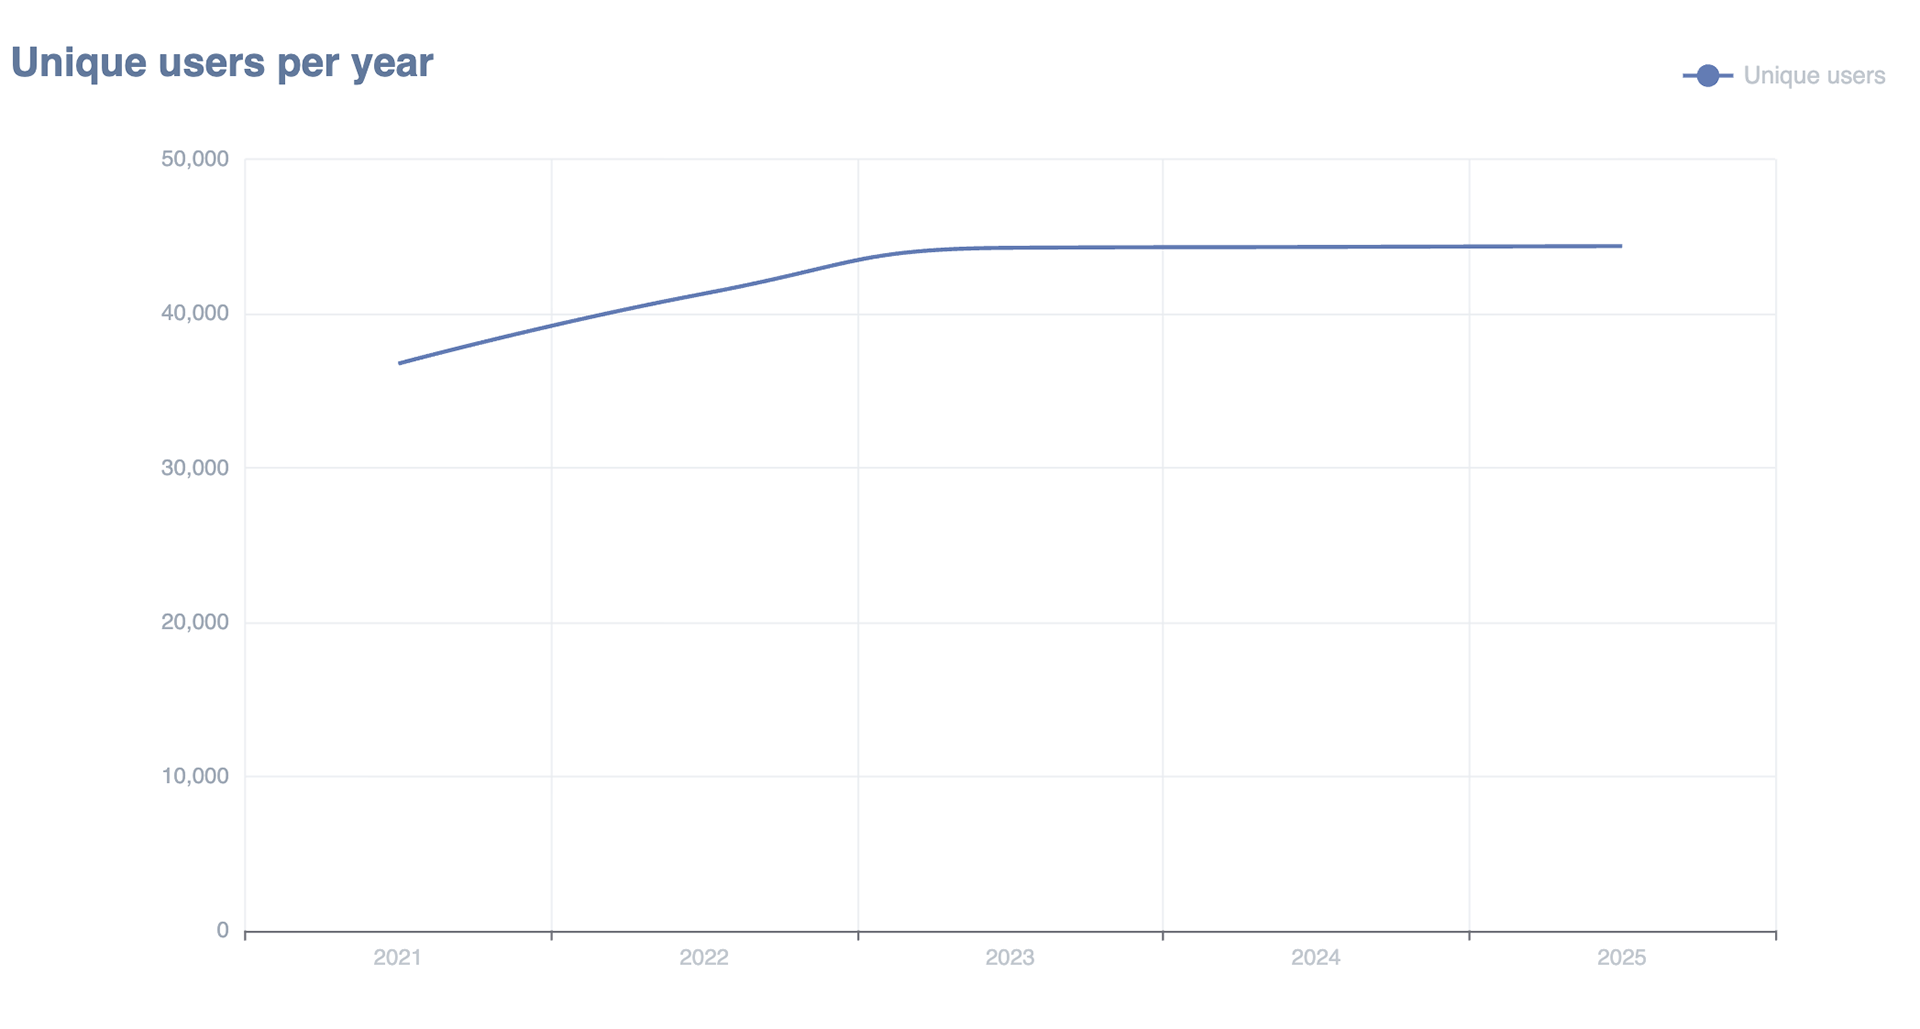 Unique users per year from 2021-2025.
New installs
A new install refers to when someone downloads the app to their device.
New installs are higher in 2024 due to users migrating to the new app version.
| Year | Number of new installs |
|---|---|
| 2025 | 9,257 |
| 2024 | 32,873 |
| 2023 | 10,410 |
| 2022 | 11,263 |
| 2021 | 24,059 |
Sessions
A user session is a sequence of actions like clicks and page views that are performed by the same user in the application during a certain period of time.
| Year | Number of user sessions |
|---|---|
| 2025 | 2,002,753 |
| 2024 | 1,953,933 |
| 2023 | 1,746,767 |
| 2022 | 1,560,869 |
| 2021 | 1,096,848 |
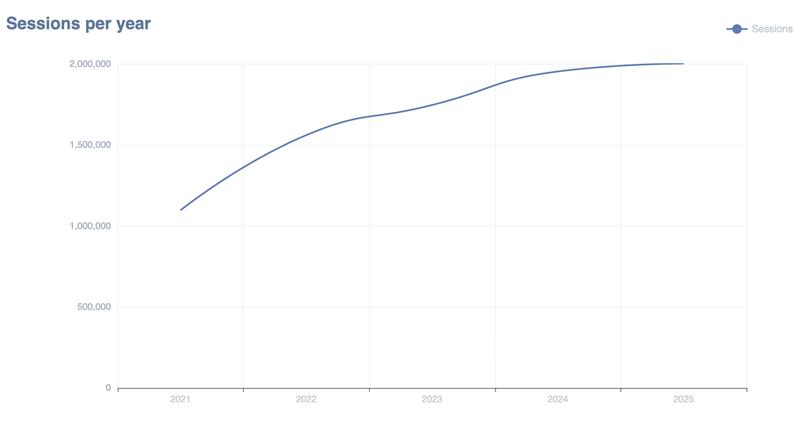 Number of sessions per year from 2021-2025.
Total pageviews
A pageview is when a user engages with a page or a section of the app during their session.
Note that while overall pageviews have decreased with the new information architecture (more evident in 2025), this reflects improved navigation efficiency. High-traffic pages are now directly linked from the landing page, reducing the number of clicks.
| Year | Total number of pageviews |
|---|---|
| 2025 | 5,530,352 |
| 2024 | 7,323,525 |
| 2023 | 7,680,172 |
| 2022 | 5,997,568 |
| 2021 | 5,360,156 |
Average session duration
Measured in minutes and seconds, the duration of a session adds up to how long a user engages with the app before they move on to something else.
| Year | Average duration of session in minutes |
|---|---|
| 2025 | 1:44 |
| 2024 | 1:44 |
| 2023 | 2:48 |
| 2022 | 2:43 |
| 2021 | 1:30 |