

article
2025 Google statistics year in review
The beginning of the year is a good time to check analytics and compare the stats with the previous calendar year. Here's an overview for Concordia.ca from January 1 to December 31, 2025, for commonly tracked metrics and reports.
General engagement metrics
We commonly track the following metrics:
Users
3.2M
↓
Views
36M
↓
Avg. engagement time
4m 36s
↑
Web traffic patterns are evolving, and our data mirrors these industry-wide shifts. Organic search traffic has declined in line with changing user behaviors and the growing presence of AI-powered tools and answers in search results.
The Avg. engagement time is the average length of time that the website had focus in the browser; this has number has seen a slight increase which is a good sign.
Language
Report description: Preference of our visitors based on their web browser setting.
Below, you can see the 10 most popular languages. Among active users, English was preferred by 81% of our visitors; French was preferred by 14% of our visitors.
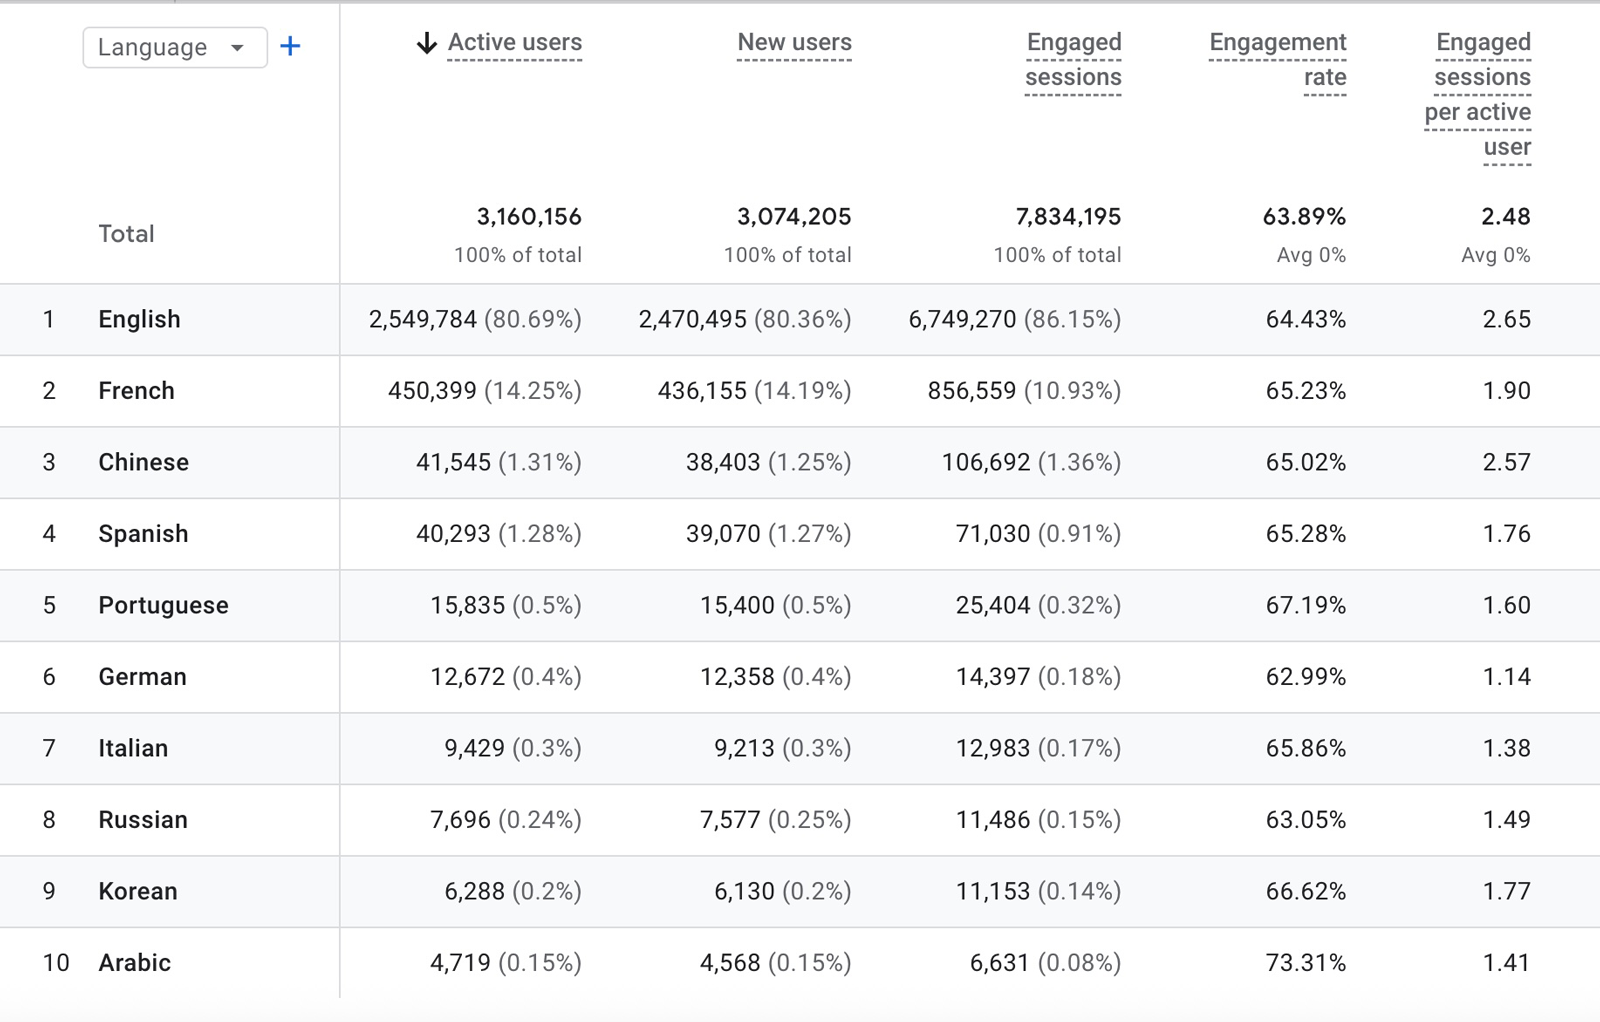 Top 10 from the Language report for 2025.
Country
Report description: Where are our visitors come from.
Below, you can see the 10 most common countries. It's no surprise that visitors from the United States ranked in second place. From the full report, it appears our visitors came from 234 countries in total – with Greenland (ranking 209) listed separately from Denmark! Vanuatu, the farthest place from Montreal, had 27 visits to our website.
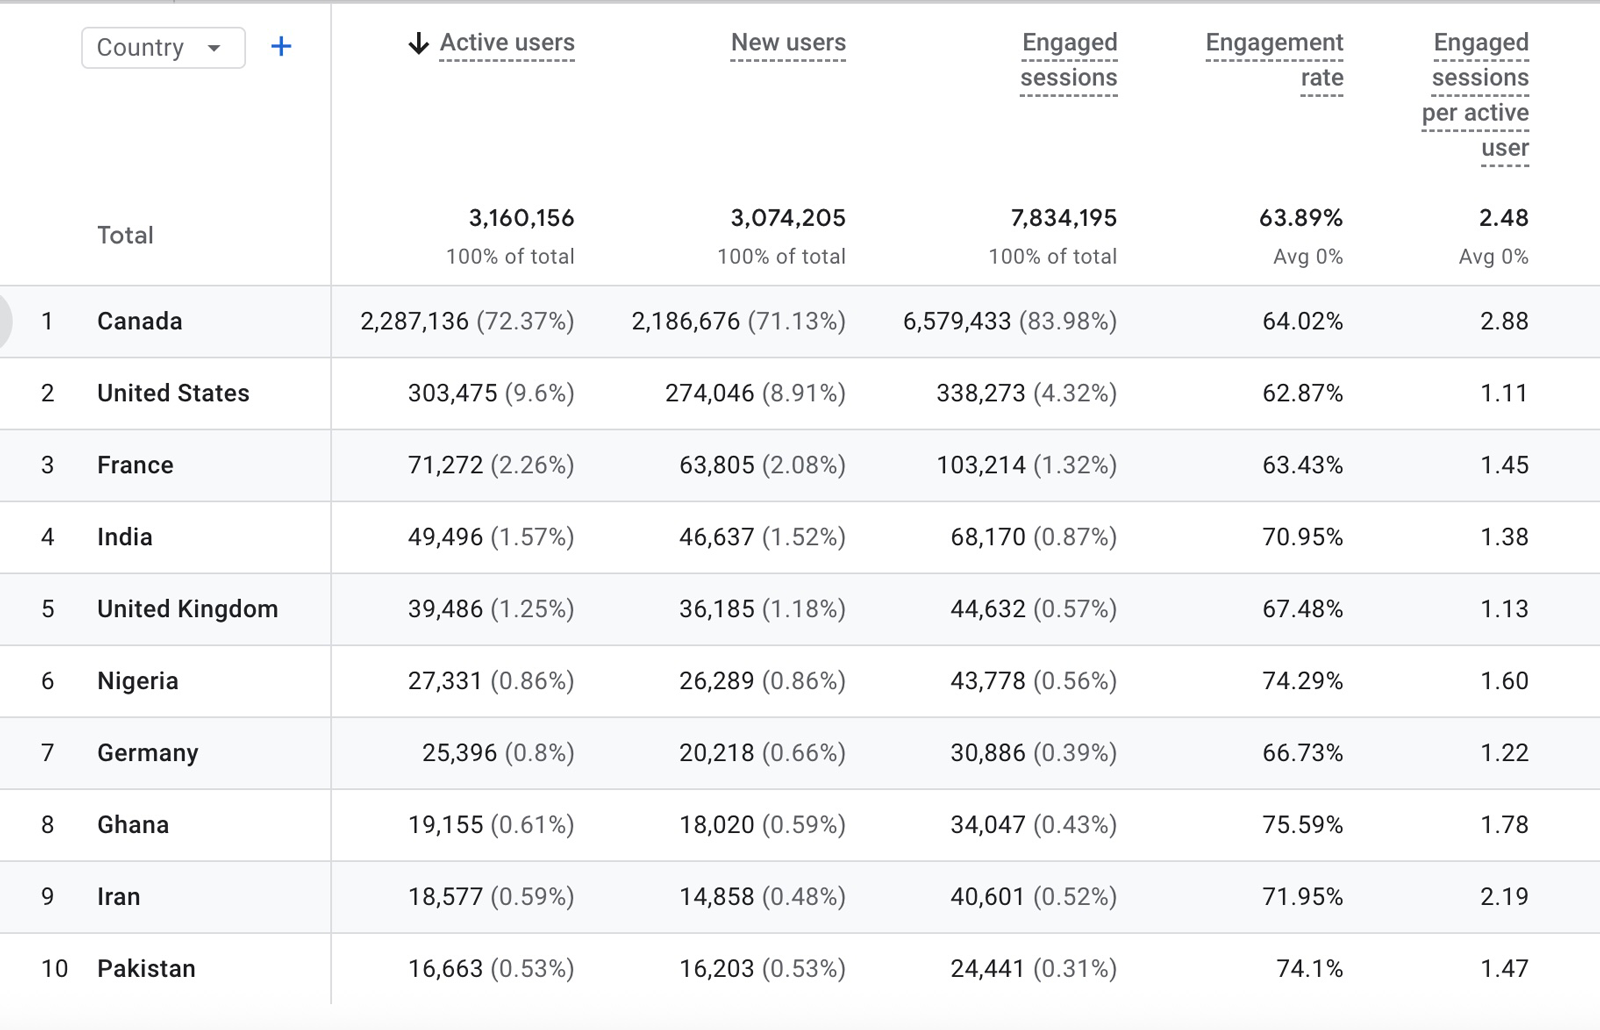 Top 10 from the Country report for 2025.
Device usage
Report description: The number of active users coming to the site by device category, i.e., by desktop, tablet or mobile.
For 2025, the traffic from desktop computers (51.2%) is slightly higher than the traffic from mobile devices (48.1%). Together, they form the bulk of users visiting our site. A little over 1.3% of our traffic comes from tablets! So, the numbers are essentially the same as last year.
Data from previous years:
In 2024, it was: desktop at 50.3%; mobile at 48.1%; tablet at 1.4%.
In 2023, it was: desktop at 50.5%; mobile at 48%; tablet at 1.5%.
In 2022, it was: desktop at 53%; mobile at 45%; tablet at 1.5%.
In 2021, it was: mobile at 52%; desktop at 46%; tablet at 2%.
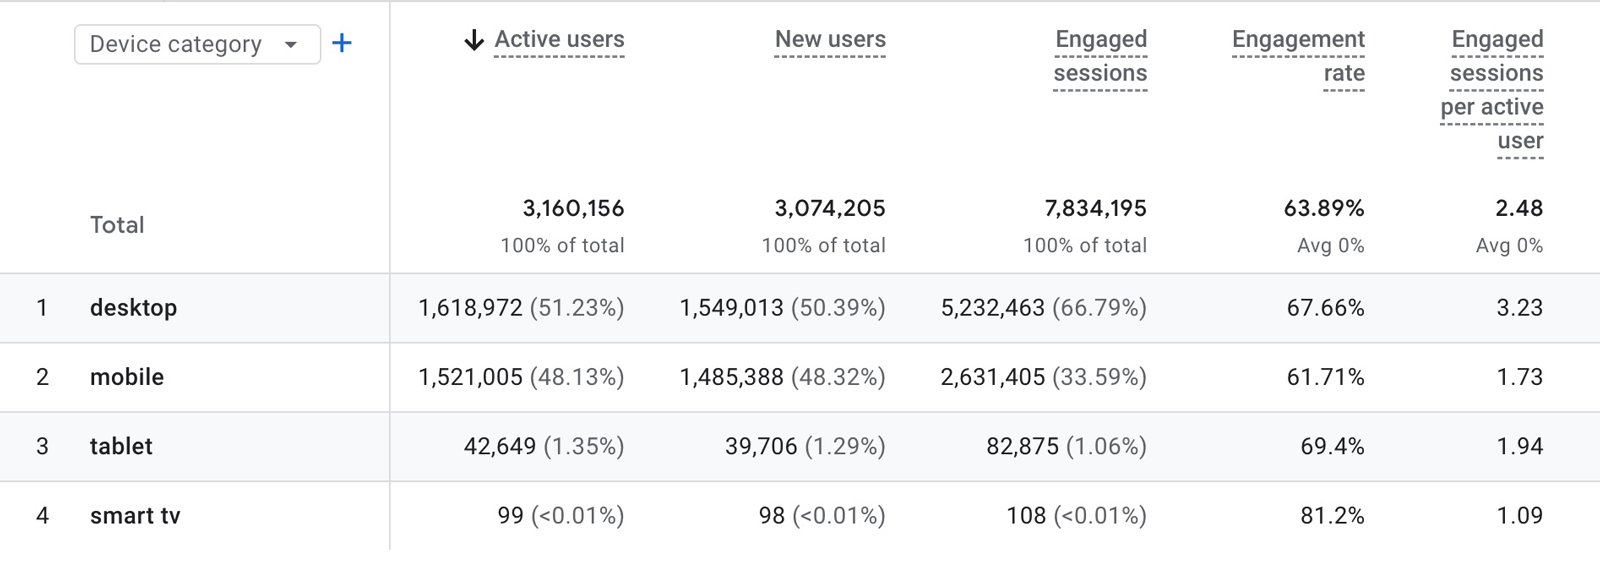 Device Category report for 2025.
Channels
Report description: High-level categories that show how people find our site.
We use the following definitions to determine this:
- Organic Search is free traffic from search engines like google.com, bing.com, etc.
- Direct is traffic coming to our website without a referral through a user's web browser, e.g., by typing the URL in the browser address bar or using a bookmark.
- Display indicates traffic coming from ads that are run on other websites, e.g., banner ads on blogs, image ads on news sites.
- Social is traffic coming from Facebook, Twitter, LinkedIn, etc. (There is now a distinction between Organic Social and Paid Social.)
- Organic Video refers to traffic from non-ad links on video sites like YouTube, TikTok, or Vimeo.
- Referral indicates traffic where users clicked a link from another site (excluding the major search engines).
- Email is traffic from links clicked in email messages, either mass email or individual messages.
- Paid Search is traffic coming from Google Ads, etc.
- Unassigned refers to traffic from sources not recognized within Google's predefined channel rules.
At 76% organic search is, by far, the most popular way people find our website.
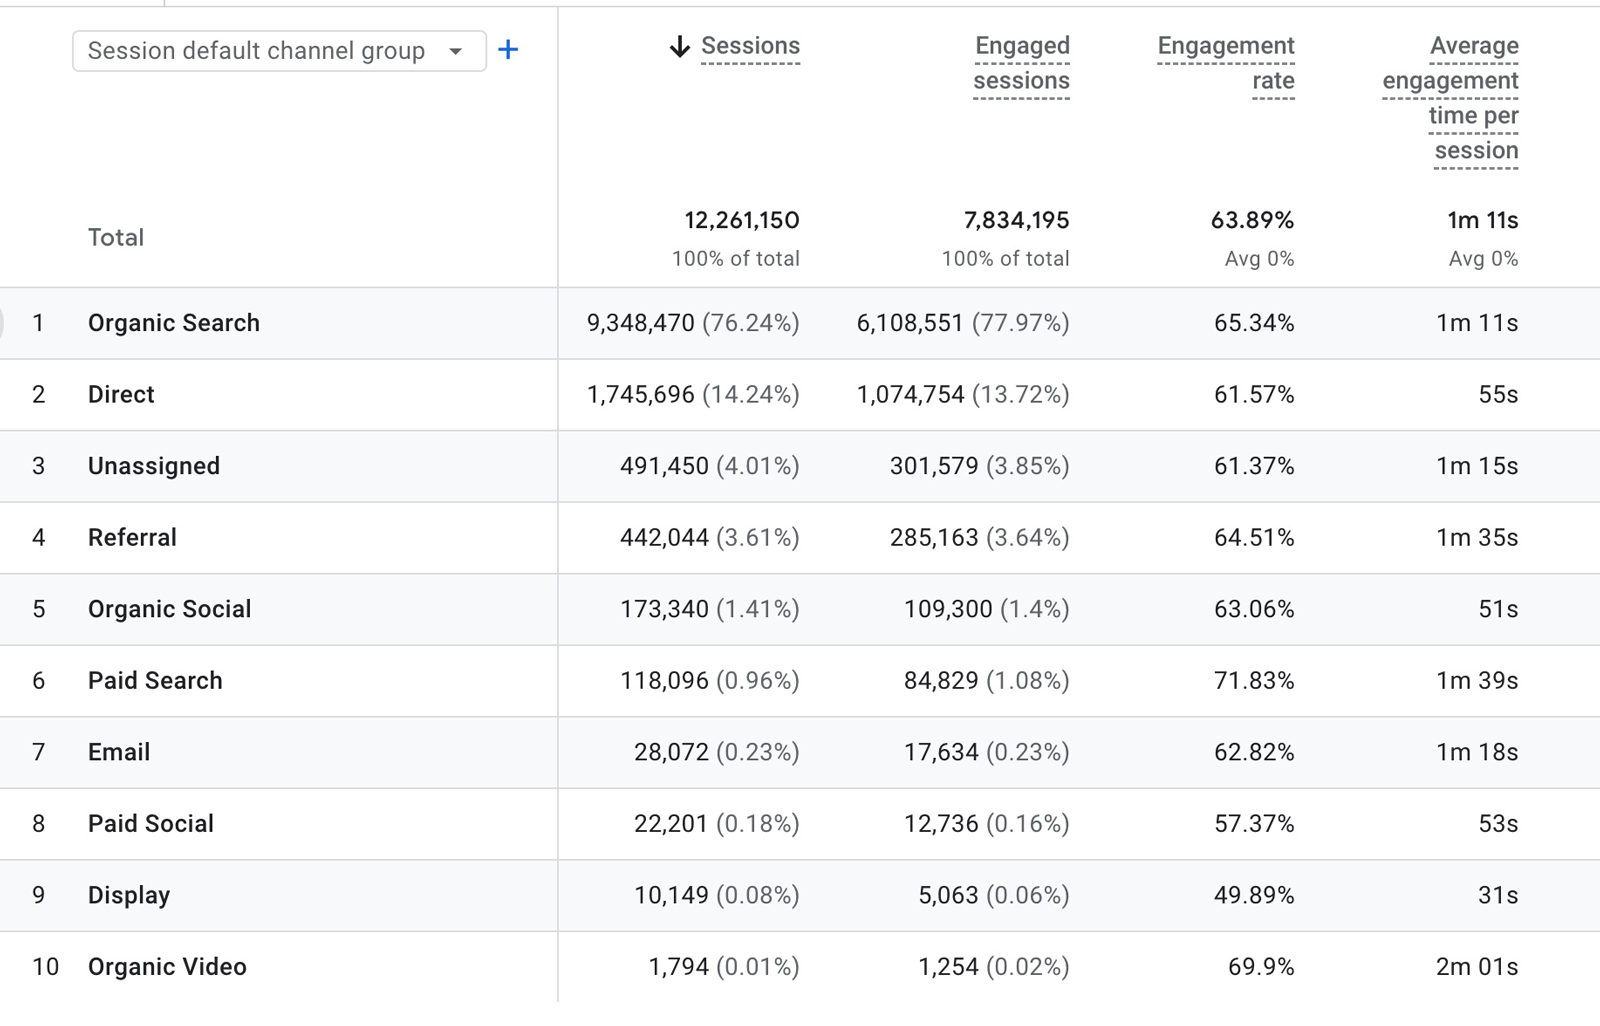 Channels report for 2025.
All pages
Report description: The pages of our website with the most traffic.
The best performing pages for 2025 included the:
- Concordia homepage (/)
- Several pages related to the Student hub, such as:
- My CU account
- Undergraduate Student hub landing page
- Course schedule
- Moodle
- Carrefour (including MY CU Account)
- The search page
- The undergraduate program list page
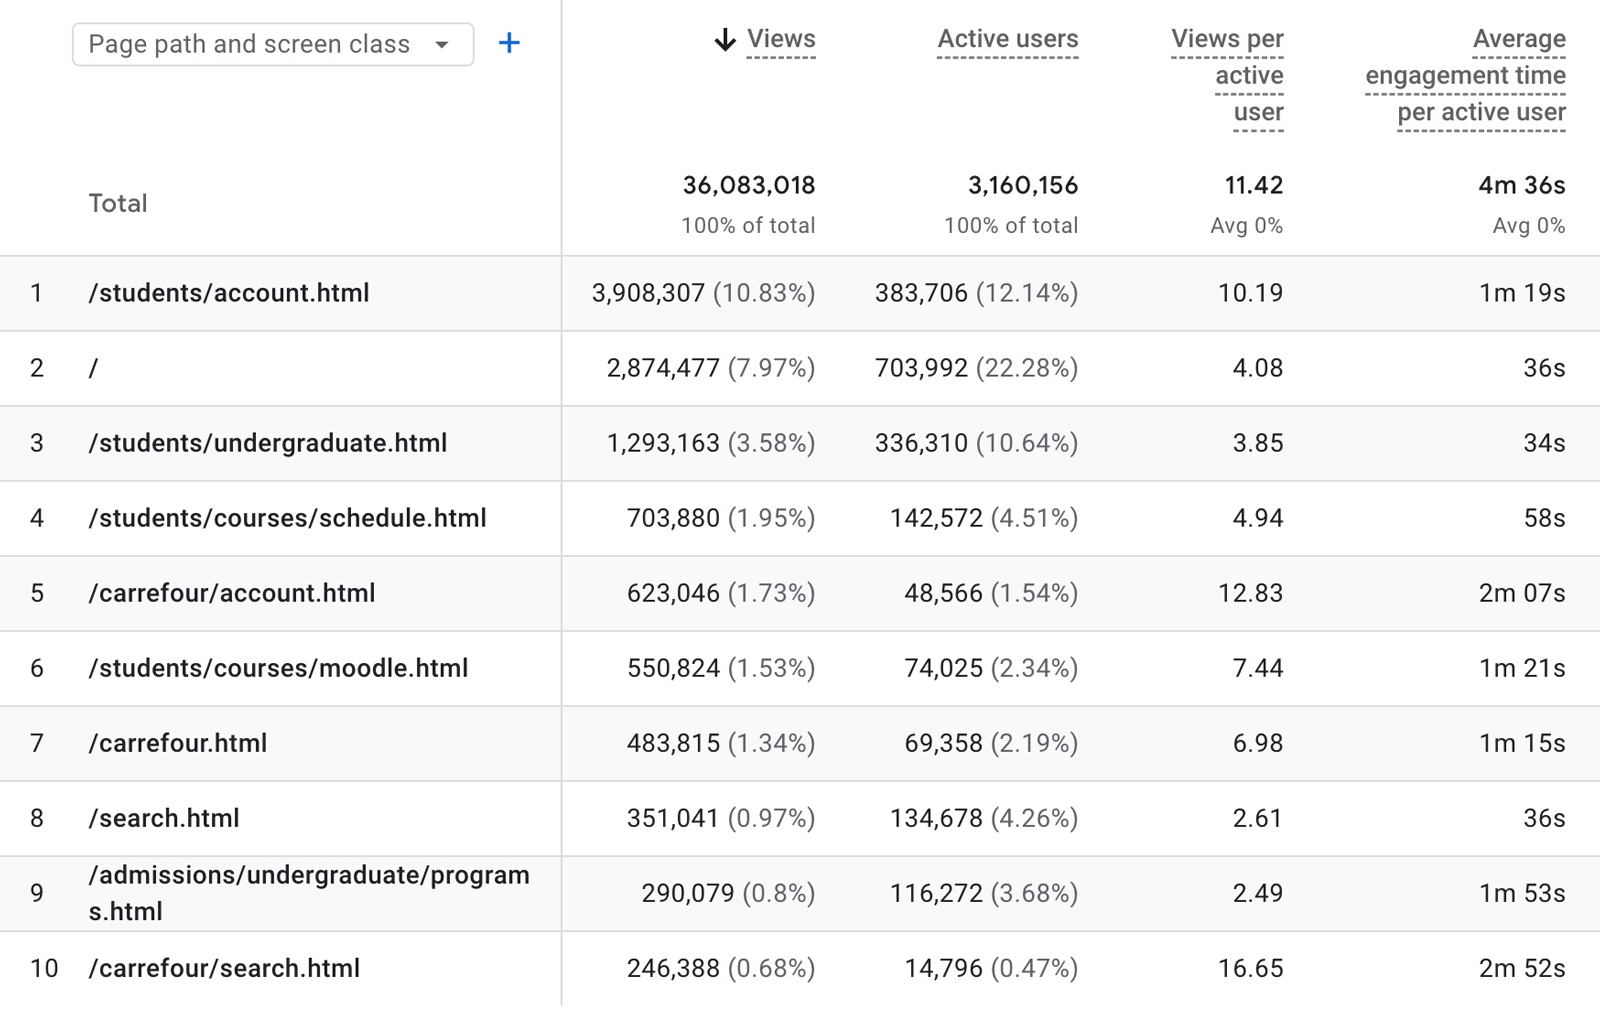 Top 10 from the All pages report for 2025.
Landing pages
Report description: The page where people first arrive at our site.
The report suggests that students are bookmarking important pages like My CU Account, Moodle and the Academic dates.
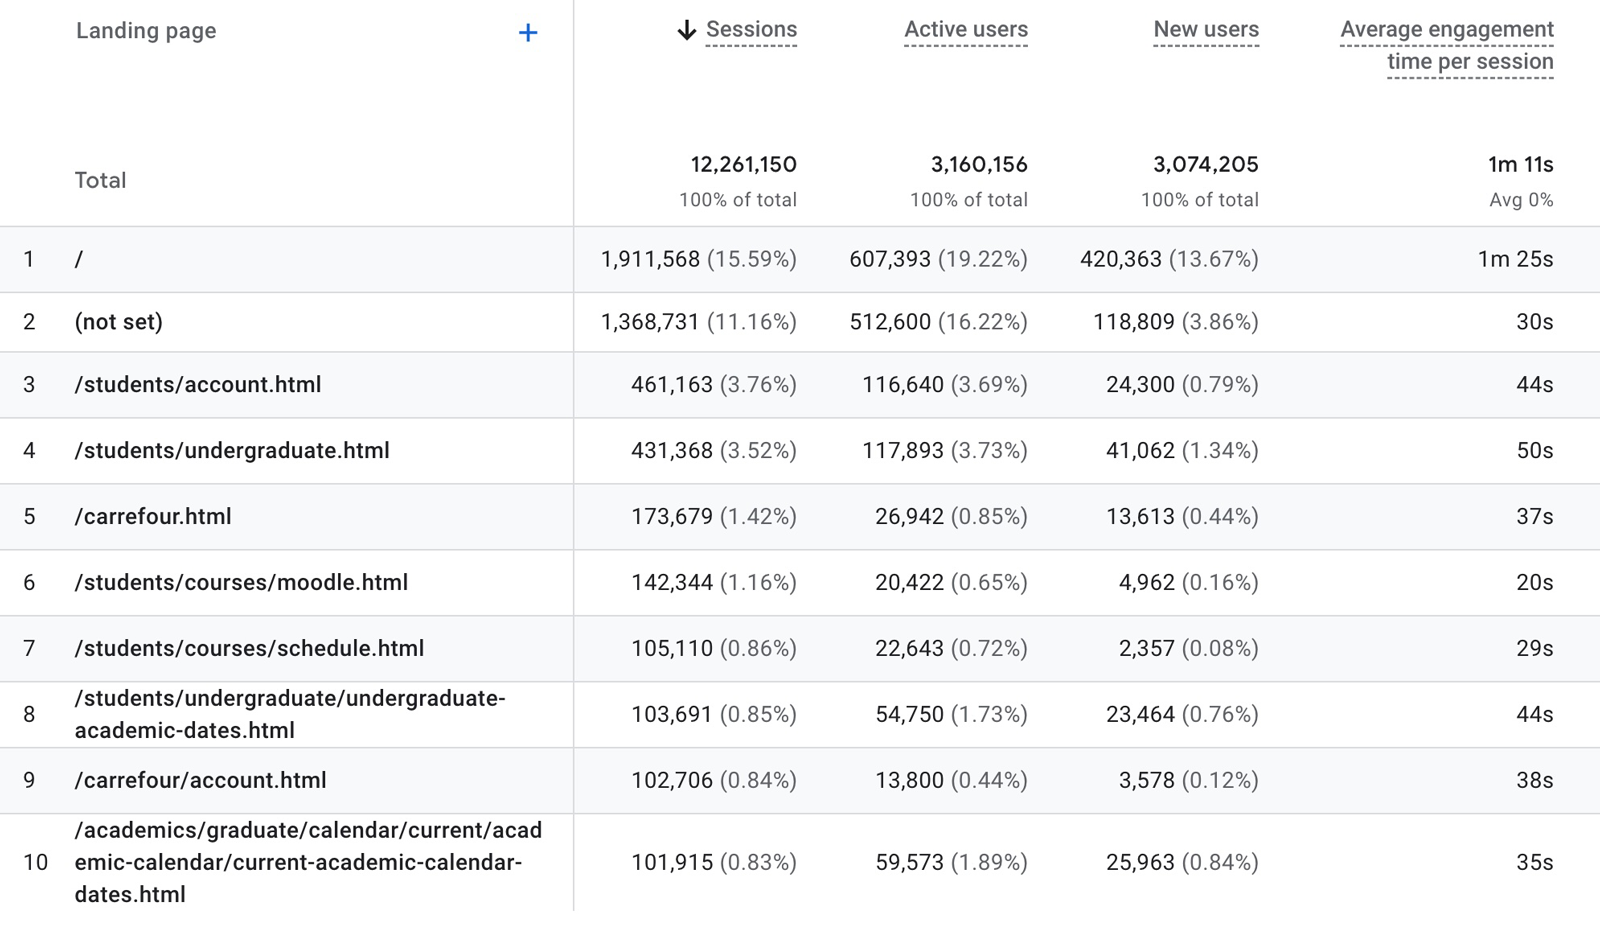 Top 10 from the Landing pages report for 2025.
Search terms
Report description: Key terms that a significant number of people have used to get to our site from Google.
Below are the top 25 search terms for 2025. This report provides fast insight into what our audience is searching when they come to visit our website.
1 – concordia
2 – concordia university
3 – moodle concordia
4 – concordia student center
5 – concordia student hub
6 – my cu account
7 – student center concordia
8 – student hub concordia
9 – concordia moodle
10 – student hub
11 – myconcordia
12 – concordia academic calendar
13 – concordia calendar
14 – concordia jobs
15 – concordia bookstore
16 – concordia university montreal
17 – université concordia
18 – student center
19 – cu account
20 – concordia login
21 – concordia email
22 – my concordia
23 – concordia programs
24 – dprint concordia
25 – my cu account concordia
Although analytics change slowly from year to year, staying abreast of these subtle changes is both interesting and important.
Official resources from Google:
Google Analytics Academy
Google Analytics – YouTube Channel
Google Analytics products – Official blog


