CLIMATE CLOCK
The world is in trouble, but it's not too late…
We all now know that the global average temperature passing the threshold of 2°C is the point where really bad things start to happen, and it becomes much more difficult to slow down the devastating effects of climate change.
But, if you look online and in the media, it’s very hard to find a good reference for when 2°C will actually happen. Presently, the 2°C target floats abstractly in the public mind. The Countdown 2° Clock acts as a public line in the sand which says, “This is the date.” It will act as a measuring stick by which we can evaluate our progress.
Each year, a week before Earth Day, the clock will be stopped. A group of leading climate scientists from around the world will evaluate the latest data. Then, on Earth Day, they will restart the clock with a new time. We will be able to see how we are doing in relation to 2°C. Have we gained or lost time?
Humanity has the power to add time to the clock, but only if we work collectively and measure our progress against defined targets.
The Countdown 2° Clock is yours to share
The clock can be embedded on any website as an iframe. For outdoor building projections or at conferences, the clock can be downloaded as a simple Google Chrome app and played on any computer running the latest version of Chrome (no internet connection is required as the clock’s date and time are validated by the internal date and time of the computer.)
We can easily customize the clock to any language, but presently it runs in French and English.
What's next?
Phase 2 will focus on building an interactive companion website with touchable data all related to time. It will allow the user to manipulate the relevant data points and explore the relationship between the factors that effect the date of 2° through an interactive graphic interface. How much will the agreements made at COP21 move the date of 2º? (The answer: only six years!) How does consuming meat move the date of 2º by country? This relationship between temperature and time is crucial in the story of climate change but has been largely missing from the narrative.
We don’t measure our lives in degrees. We measure our lives with time. Time is the key data point we need to include to make climate change relatable.
The Countdown 2º Clock is a collaboration between David Usher (CloudID Media) and Damon Matthews from Concordia University.
Team members:
David Usher is an artist, bestselling author, entrepreneur and keynote speaker
Damon Matthews is an associate professor and Concordia University Research Chair (Climate Science and Sustainability) in the Department of Geography, Planning and Environment.
Carmela Cucuzzella is an assistant professor in the Department of Design and Computation Arts at Concordia University
Prem Sooriyakumar is a knowledge broker at Concordia University
Playmind Creative Studio specializes in the conception, realization and development of digital media
Paul Simard is principal director of development for the Faculty of Arts and Science
David Oram is science assistant to the executive director of Future Earth
Jean-Patrick Toussaint is director of scientific projects for the David Suzuki Fondation
Marcus Peters is a Concordia student in the Department of Sociology and Anthropology
Daniel Horen Greenford is a Concordia student in the Department of Geography, Planning and Environment
Jonathan Gallivan, Waseem Hasan and Adam Davies are programmers
Music:
Patrick Watson – The Great Escape
David Usher – Prelude (Acoustic)
Support organizations:
Concordia University
David Suzuki Foundation
Future Earth
Climate Reality Project
Installations
Past:
David Suzuki Foundation Event – February 25, 2016
Centre for Sustainable Development Building
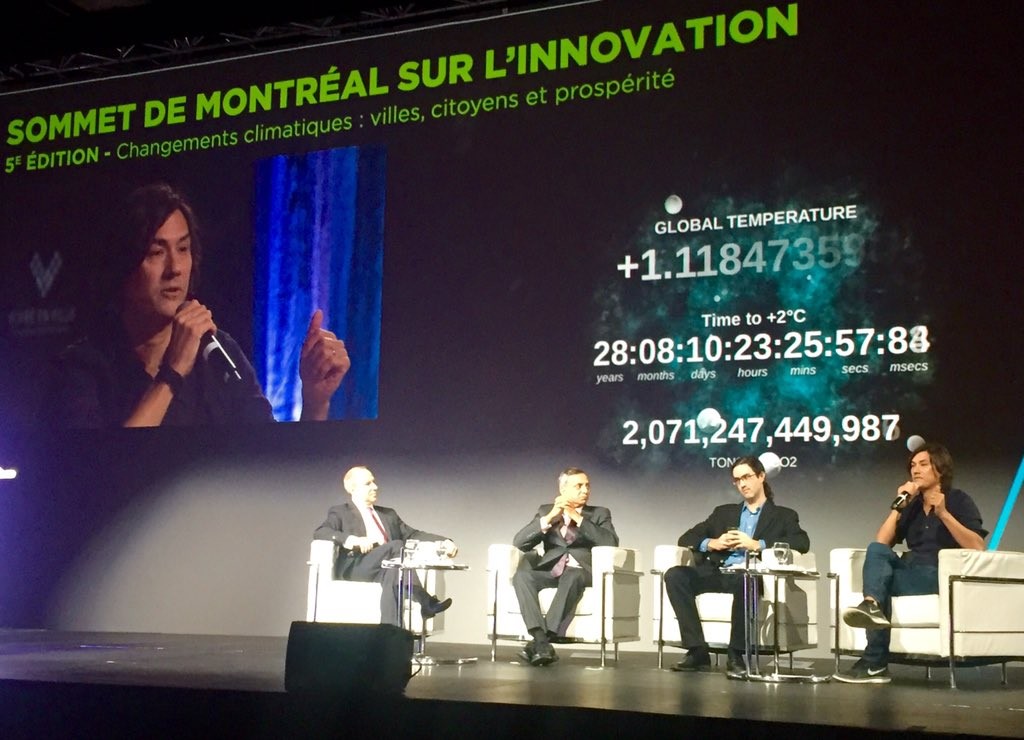
Innovation Summit of Montreal Conference
Montreal – Concordia University – April 20, 21, 22 (Earth Day) and 23, 2016
Vancouver – Earth Day, April 22, 2016
C2 Montreal Conference – May 24-26, 2016
Multi-city projections planned for COP22 — December 2016
Montreal – Concordia University – December 5, 6 and 7, 2018
For more information, or to use the clock as a projection at your event, contact us at: hello@cloudidmedia.com
Join the global conversation by using the #2degrees hashtag.
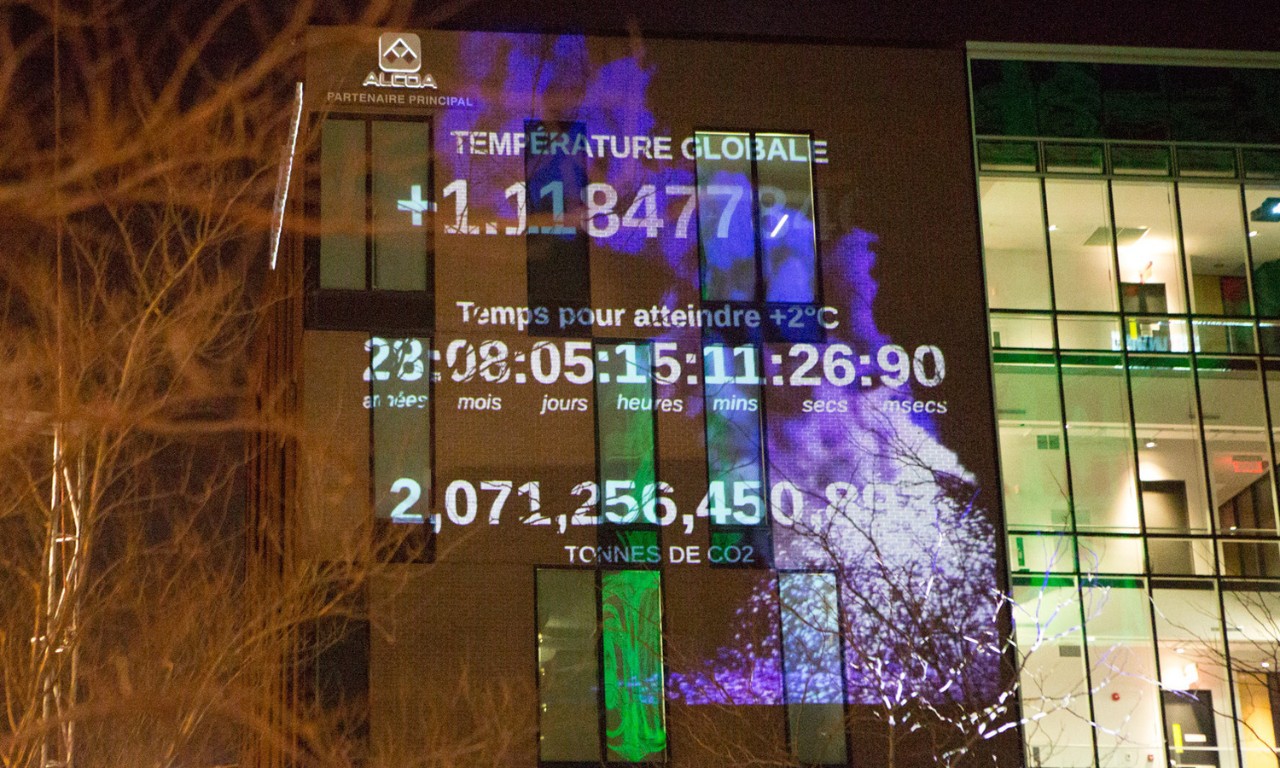
The numbers on the clock
The Countdown 2 Degrees clock shows our best estimate of when global temperature will reach 1.5 and 2°C above pre-industrial temperatures, assuming global CO2 emissions continue to increase following the observed trend of the past five years.
All numbers are estimated relative to the period between 1861 and 1880, which is used as the reference temperature for the “pre-industrial” period. This is the earliest period for which we have reliable measurements of global temperature, and is the most common reference period for pre-industrial temperatures used in scientific analyses and policy discussions.
The clock includes the following elements:
1) Tonnes of CO2
This value shows the total accumulated CO2 emissions from fossil fuel burning, cement manufacture and land-use change since 1870, based on data from the Carbon Dioxide Information Analysis Center, combined with the most recent CO2 emissions data from the Global Carbon Project.
2) Global temperature
This number represents the human contribution to global temperature increases observed since the period between 1861 and 1880. The value shown is consistent with the recently proposed index of human-induced warming. This index represents the portion of observed temperature change that can be attributed to all human drivers of climate change.
3) Time to 2°C
The projection of the +2°C date is based on extrapolating the most recent 5-year trend of CO2 emissions, which have increased on average by 1.5 per cent per year between 2010 and 2015. Based on this annual rate of increase, total CO2 emissions will increase to 3,500 billion tonnes of CO2 on December 16, 2044.
3500 billion tonnes is the best estimate of the total CO2 emissions since 1870 that would produce 2°C of global temperature increase in a scenario of increasing emissions, including the warming contribution from changes in non-CO2 greenhouse gas and aerosol emissions.
4) Time to 1.5°C
There are very few studies of emissions scenarios that lead to only 1.5°C of global warming, so there is not yet a scientifically robust best estimate of the total quantity of CO2 emissions that push us past this climate target.
We have therefore assumed that temperatures will increase exponentially — which is consistent with the prescribed rate of increase of CO2 emissions — from the current value of human-induced warming (+1°C, occurring in February 2016) to +2°C warming in December 2044. This results in an estimate of +1.5°C warming occurring on July 26, 2032.
Supporting scientific literature and data sources:
- Boden, T. A., Marland, G. & Andres, R. J. Global, regional, and national fossil-fuel CO2 emissions. Carbon Dioxide Information Analysis Center, Oak Ridge National Laboratory, US Department of Energy, Oak Ridge, Tenn, USA (2013). Data available at: http://cdiac.ornl.gov
- Houghton, R. A. et al. Carbon emissions from land use and land-cover change.Biogeosciences 9, 5125–5142 (2012). Data available at: http://cdiac.ornl.gov
- Jackson, R. B. et al. Reaching peak emissions. Nature Climate Change (2015). Data available at: http://www.globalcarbonproject.org
- Le Quere, C. et al. Global carbon budget 2014. Earth Syst. Sci. Data 7, 47–85 (2015). Data available at: http://www.globalcarbonproject.org
- Otto, F. E. L., Frame, D. J., Otto, A. & Allen, M. R. Embracing uncertainty in climate change policy. Nature Climate Change 5, 917–920 (2015).http://www.nature.com/nclimate/journal/v5/n10/full/nclimate2716.html
- Morice, C. P., Kennedy, J. J., Rayner, N. A. & Jones, P. D. Quantifying uncertainties in global and regional temperature change using an ensemble of observational estimates: The HadCRUT4 data set. J Geophys Res-Atmos 117, (2012). Data available at: https://crudata.uea.ac.uk/cru/data/temperature/
- Friedlingstein, P. et al. Persistent growth of CO2 emissions and implications for reaching climate targets. Nature Geoscience 7, 709–715 (2014).http://www.nature.com/ngeo/journal/v7/n10/abs/ngeo2248.html
- Rogelj, J. et al. Differences between carbon budget estimates unravelled. Nature Climate Change 6, 245–252 (2016).http://www.nature.com/nclimate/journal/v6/n3/full/nclimate2868.html