2017 employment statistics
Each year Career Management Services (CMS) conducts an in-depth survey with our graduated students. Below you will find reported salaries, employment status, employment location & current employers of the respondents to the Undergraduate Student Exit Survey and the Graduate Student Exit Survey (below).
The employment information below is based on the John Molson School of Business's Annual Exit Survey. All compensation information is self-reported by students. Note that these statistics reflect respondents’ annual salaries only. Typically, compensation depends not only on annual salary but other elements as well : signing bonus, performance bonus, fringe benefits, flexible schedule, annual vacation, pension plan, cost of membership to an association or professional corporation, professional development, company car and other non-monetary benefits. Also note that salaries are determined based on a variety of factors which can include: previous experience, location, industry, business size, etc.
| Major | Minimum | Maximum | Average |
|---|---|---|---|
MBA |
$50,000.00 |
$130,000.00 |
$87,000.00 |
MBA with CFA |
$48,000.00 |
$83,000.00 |
$69,000.00 |
EMBA |
$70,000.00 |
$160,000.00 |
$95,000.00 |
MSc |
$50,000.00 |
$85,000.00 |
$68,000.00 |
GDBA |
$31,000.00 |
$79,000.00 |
$58,000.00 |
CPA |
$55,000.00 |
$155,000.00 |
$89,000.00 |
The table below represents the percentage of participating students by degree with an indication of the percentage of students that had successful found employment at the time of the survey.
Note: students that did not answer the question or that indicated that they were not seeking employment (either due to continuing education or other reasons) were not included in determining the Percentage Employed at time of Survey.
| Degree | % Employed 3 Months After Graduation |
|---|---|
| MBA | 87% |
| MBA with CFA | 91% |
| EMBA | 90% |
| MSc | 55% |
| PhD | 100% |
| GDBA | 83% |
| CPA | 100% |
| Overall | 87% |
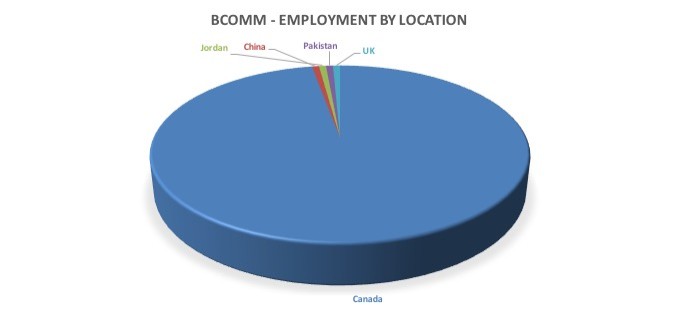
The graph below represents the percentage of students in relation to the location they recorded being employed in at the time of the survey.
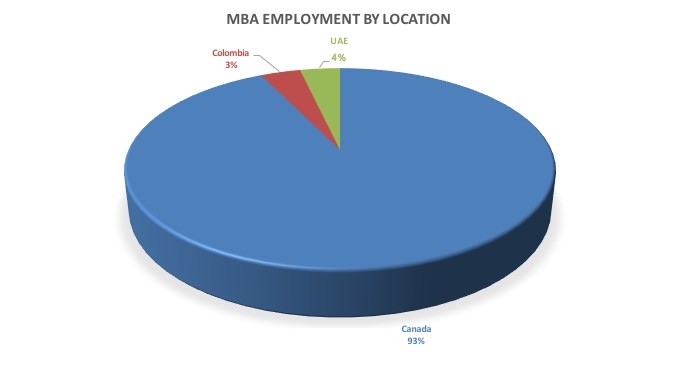
| Country | Frequency | Valid Percent |
|---|---|---|
| Canada | 26 | 92.9% |
| Colombia | 1 | 3.6% |
| UAE | 1 | 3.6% |
| Total | 28 | 100% |
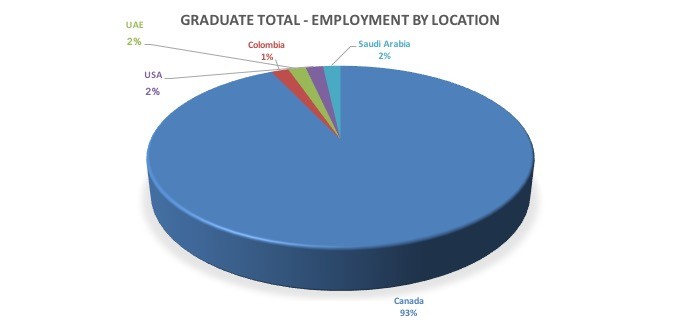
| Country | Frequency | Valid Percent |
|---|---|---|
| Canada | 56 | 93% |
| Colombia | 1 | 1.75% |
| UAE | 1 | 1.75% |
| USA | 1 | 1.75% |
| Saudi Arabia | 1 | 1.75% |
| Total | 60 | 100% |
The graph below represents the percentage of students in relation to the industry they recorded being employed in at the time of the survey.
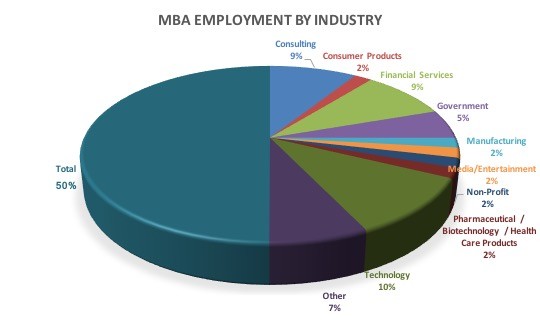
| Industry | Frequency | Valid Percent |
|---|---|---|
| Consulting | 5 | 17.9% |
| Consumer Products | 1 | 3.6% |
| Financial Services | 5 | 17.9% |
| Government | 3 | 10.7% |
| Manufacturing | 1 | 3.6% |
| Media/Entertainment | 1 | 3.6% |
| Non-Profit | 1 | 3.6% |
| Pharmaceutical / Biotechnology / Health Care Products | 1 | 3.6% |
| Technology | 6 | 21.4% |
| Other | 4 | 14.3% |
| Total | 28 | 100% |
Below is a list of organizations employed at as recorded by participating students at the time of the survey.
- BDC
- Artitalia Group Inc.
- Autolog
- Canadiab Food Inspection Agency
- CGI
- City of Dorval
- Cogeco connecxion
- Commission Scolaire Sir Wilfrid Laurier
- Concordia University
- D2L
- Dawson College
- Enzyme Labs
- Facilité informatique
- Genetec
- Hénaire Danis Brunet
- Indigo
- Inditex
- KPMG
- Lumenpulse
- McGill University
- MPC
- MUHC
- National Bank of Canada
- Navada Ltée
- NRCan
- OOHLALA Mobile Inc
- Paladin Labs
- Paysafe
- Peak Performance 2
- Pontificia Universidad Javeriana
- Private company
- RBC
- RBMA
- Richter Consulting
- RI-MUHC
- SAP
- Sapient Global Markets
- SNC Lavalin
- Societe Internationale de Telecommunications, Canada Inc
- TD
- The Collaboration Vector
- Unilever
- Unisource Canada
The table below shows the minimum, maximum, average and range for Student's reported salaries, at time of survey, broken down by each major.
| Major | Minimum | Maximum | Average |
|---|---|---|---|
| Accountancy | $25,000.00 |
$71,000.00 |
$49,000.00 |
Business Technology Management |
$35,000.00 |
$72,000.00 |
$47,600.00 |
| Economics | n/a | n/a | n/a |
Finance |
$28,000.00 |
$100,000.00 |
$52,500.00 |
Human Resource Management |
$31,000.00 |
$57,000.00 |
$41,000.00 |
International Business |
$32,000.00 |
$64,000.00 |
$49,000.00 |
Management |
$33,000.00 |
$125,000.00 |
$48,000.00 |
Marketing |
$20,000.00 |
$65,000.00 |
$47,500.00 |
Supply Chain Operations Management |
$33,000.00 |
$82,000.00 |
$52,000.00 |
The table below represents the percentage of participating students by major with an indication of the percentage of students that had successful found employment at the time of the survey.
Note: students that did not answer the question or that indicated that they were not seeking employment (either due to continuing education or other reasons) were not included in determining the Percentage Employed at time of Survey.
| Major | % Employed 3 Months After Graduation |
|---|---|
| Accountancy | 73% |
| Business Technology Management (BTM) |
85% |
| Economics | n/a |
| Finance | 85% |
| Human Resource Management | 75% |
| International Business | 68% |
| Management | 76% |
| Marketing | 92% |
| Supply Chain Operations |
88% |
| Overall | 80% |
The graph below represents the percentage of students in relation to the industry they recorded being employed in at the time of the survey.
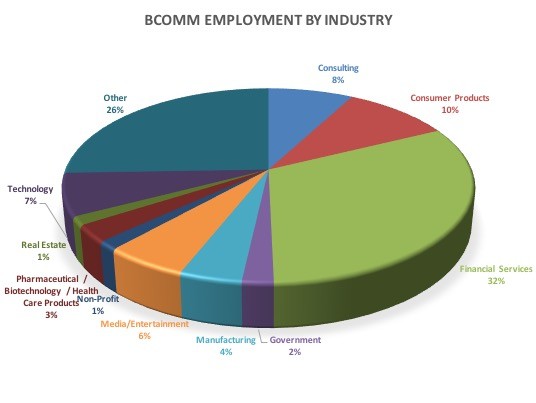
| Industry | Frequency | Valid Percent |
|---|---|---|
| Consulting | 11 | 7.8% |
| Consumer Products | 14 | 9.9% |
| Financial Services | 45 | 31.9% |
| Government | 3 | 2.1% |
| Manufacturing | 6 | 4.3% |
| Media/Entertainment | 8 | 5.7% |
| Non-Profit | 2 | 1.4% |
| Pharmaceutical / Biotechnology / Health Care Products | 4 | 2.8% |
| Real Estate | 2 | 1.4% |
| Technology | 10 | 7.1% |
| Other | 36 | 25.5% |
| Total | 141 | 100% |
Below is a list of organizations employed at as recorded by participating students at the time of the survey
- 94.7 Hits FM
- ADF Pharmaceuticals
- Aéroports de Montréal
- Aerotek
- Air Canada
- ALDO Group
- Altios International
- Arthur J Gallagher
- Assante Capital Management
- Bassett & Walker International
- BBG management
- BMO
- Canada Border Services Agency
- Canadian National Railway
- Canadian Wood Products
- Capital Bank of Jordan
- CCEI
- CGI
- CIBC
- CIDEP I.Q.C
- CN
- Contax Inc.
- Coop fédérée
- Costco
- Cyclo Nord Sud
- Deloitte
- Discovery Air Defence
- EDCE
- Ericsson
- Ernst & Young
- EY
- Feldhammer Dixo Kwo Inc.
- Gameloft
- Gregoire & Bertrand CPA
- Groupe Dynamite Inc.
- Hershey Canada
- IBM Canada
- Industrielle Alliance
- Inovestor
- Interactive Brokers Canada
- Intercash
- Investment Planning Council
- JAM Industries
- Jean-Coutu
- Jewish General Hospital
- Jones Lang Lasalle
- KBD Insurance (Intact)
- KPMG
- Landr
- Laurantian Bank
- LCDH MTL
- loanscanada.ca
- L'Oréal
- Lululemon
- Manulife Securities
- Marsh Canada
- MD Financial Management
- Mindgeek
- Mobilia
- National Research Council of Canada
- Nature's Touch
- OMG Inc.
- OPM Pros
- Passport Canada
- Payza
- Pharmaceutical Company
- PIP Canada
- PiVAL International Inc.
- Procter & Gamble
- PSP Investments
- Puremed Canada
- PwC
- Quartexx Managment
- RBC
- Resolute Forest Products
- Richelieu Hardware
- RINOX INC
- Rogers Communications
- Rolf C. Hagen
- SAP Canada Inc.
- SAQ
- Scoop Models
- Scotiabank
- Sekure Merchant Solutions
- Semintha Nutraceuticals
- Sherwin Williams
- Sid Lee
- Sika Canada Inc.
- SimplyBridal
- Six Flags
- SNC Lavalin
- State Street
- Stefanka
- Swissport
- TD Canada Trust
- TD Wealth Management
- Thinking capital
- TMX Inc.
- TRU Simulation and Training
- Uber
- Ubisoft
- UBS Securities Canada Inc.
- Vacances compass
- ValsTech
- Venngo
- Via Rail
- Ville de Pointe-Claire
- Waterax
- WealthBar Financial
- World Assurance
- Zimmer CAS
